Tag Archives: nreum

Arbitraging 20% As An Exuberant Closed End Fund Returns To Normalcy

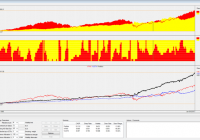
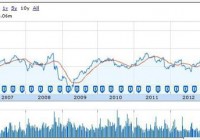
Summary ETFs and CEFs that track emerging market economies are often popular with foreign investors because they mitigate some risks of owning foreign equities such as accessibility, liquidity and local governance. However, emerging economies often have substantial risks that cannot be priced out by convenience, so these funds usually trade at a discount to their NAV. Occasionally, irrational exuberance will elevate an ETF or CEF above its NAV, creating an arbitrage opportunity. The CEF CUBA has been steadily returning to normalcy after a zealous run following President Obama’s Cuban Diplomacy announcement; ~20% profit potential is still on the table. Business As Usual Exchange traded funds (ETFs) and closed end funds (CEFs) are convenient – one can buy a single asset and have a basket of exposure. ETFs and CEFs can be especially useful when they track foreign stock markets. They can mitigate a host of risk factors, such as accessibility to a foreign stock market, the liquidity of foreign equities, and local governance’s barriers to entry for foreign capital. (Sourced from Google via Barclays ) While ETFs and CEFs can neatly catalog foreign equities into a convenient bundle, risks inherent to emerging markets remain. Currency woes, inflation battles, corruption – the list isn’t a short one. Therefore, it is rather common for ETFs and CEFs to trade at a discount to their net asset value (NAV). This is a combination of risk premium as well as management and expense fees. Typically the spread between a fund’s NAV and its tick price – its discount/premium – is fairly constant. EM risk factors and management fees are generally sticky, so there isn’t much reason for the spread to fluctuate. However, an exogenous event can distort the discount, even turning it into a premium. This creates potential arbitrage opportunities. Business Is… Unusual Three and a half weeks ago, President Obama ordered a return to full diplomatic relations with Cuba. While a significant departure from the decades old stalemate, significant hurdles remain. In particular, the 54-year-old trade embargo remains. (Source: Daily Mail UK ) This highly unexpected event ignited an energetic rally in any equity with even loose ties to Cuba or the Caribbean. The Herzfeld Caribbean Basin Closed End Fund (NASDAQ: CUBA ) was one such beneficiary. At one point, it traded nearly 50% above its NAV. Now that the political reality is beginning to sink in, CUBA’s premium has seen a steady reduction. However, it is still trading well above a rational value and the spread can be approximately arbitraged out, creating a nearly risk-free investment. The Nuts And Bolts Despite its suggestive ticker, the CUBA CEF is not relegated to Cuban assets (something that would be nearly impossible); in fact, it isn’t even meant to mimic the Cuban economy in particular. To quote from the fund management’s website : The Herzfeld Caribbean Basin Fund’s investment objective is long-term capital appreciation. To achieve its objective, the Fund invests in issuers that are likely, in the Advisor’s view, to benefit from economic, political, structural and technological developments in the countries in the Caribbean Basin, which consist of Cuba, Jamaica, Trinidad and Tobago, the Bahamas, the Dominican Republic, Barbados, Aruba, Haiti, the Netherlands Antilles, the Commonwealth of Puerto Rico, Mexico, Honduras, Guatemala, Belize, Costa Rica, Panama, Colombia and Venezuela. The fund invests at least 80% of its total assets in a broad range of securities of issuers including U.S.-based companies that engage in substantial trade with, and derive substantial revenue from, operations in the Caribbean Basin Countries. Since the fund’s investment scope has a loose mandate, let’s see what some of the actual assets are: CUBA Top 25 Holdings Company Ticker CUBA Weight Country Copa Holdings CPA 8.46% United States MasTec Inc MTZ 6.28% United States Coca-Cola Femsa SAB KOF 6.03% Mexico Royal Caribbean RCL 5.34% United States Seaboard Corp SEB 5.17% United States Lennar Corp LEN 4.80% United States Norwegian Cruse Line Holdings NCLH 4.01% United States Banco Latinamericano de Comercio Exterior BLX 3.96% United States Carnival Corporation CCL 3.80% United States Consolidated Water Co CWCO 3.71% United States America Movil AMX 3.44% Mexico BanColombia CIB 3.34% Colombia Watsco Inc WSO 3.24% United States Grupo Televisa TV 2.94% Mexico Chiquita Brands International CQB 2.77% United States Freeport-McMoRan Inc FCX 2.69% United States Fomento Economico Mexicano FMX 2.67% Mexico Cemex CX 2.26% Mexico Steiner Leisure STNR 2.24% United States TECO Energy TE 2.15% United States Norfolk Southern Corp NSC 1.87% United States Wal-Mart de Mexico OTCQX:WMMVY 1.62% Mexico Tahoe Resources Inc THO 1.48% Canada Fresh Del Monte Produce Inc FDP 1.35% United States Atlantic Tele-Network Inc ATNI 1.32% United States (Source: Morningstar ) The above table represents 86.94% of the closed end fund. Fund Insiders Sell Millions Fund insiders were clearly aware of their good fortune – it’s not every day that one’s holdings start to trade nearly 50% above their intrinsic value! Consider the chart below of insider disposals charted behind CUBA’s adjusted close price: (click to enlarge) (Chart created by author; data from SEC , NASDAQ and Yahoo Finance ) The above transactions add up to nearly $4,000,000 of equity disposals. CUBA is worth around $28 million now, so the disposals were of an meaningful magnitude. In fact, with around 3,700,000 common shares outstanding, insiders sold nearly 8% of the entire float. Those transactions were the only sales by insiders in the last 12 months. The Fun Isn’t Over While the boat may have sailed on the astronomical overvaluation of a few weeks ago, there is still plenty of juice left for a mean reversion trade (or for a nearly risk-free approximate arbitrage). The CEF still trades ~11% above its NAV, and that’s cream waiting to be scraped off the top. However, it is entirely reasonable to expect the potential profit to be closer to 20%. Over the past 3 years – including the data distorting recent spike – CUBA has traded at an average discount of 8.70% to its NAV. Over the past six months – inclusive of the recent spike, again – the average discount has been 8.76%. ( Source ) (Source: CEFConnect ) It is reasonable to expect an eventual reversion to the historical discount rate yielding a potential profit of ~20%. Let’s discuss why. Plus Ca Change, Plus C’est La Meme Chose Emerging market funds, whether bundled as an ETF or a CEF, typically trade at a discount to their NAV because of risk premia and management fees. The most recently reported fiscal year saw CUBA with a reported total expense ratio of 2.46%. ( Source ) General risks to emerging market funds apply: currency risks, inflationary tendencies, payments on foreign debt, and corruption, to name a few. Many of CUBA’s holdings are readily accessible for retail investors because they trade either: directly on American exchanges, as ADRs on American exchanges, or OTC. There is no meaningful reason for CUBA to continue to trade above its NAV. The premium is totally resultant from irrational exuberance relating to President Obama’s announcement and traders buying into an investment vehicle that is (superficially) related to the geopolitical news. This is clearly evident when comparing the CEF to its NAV over a long time frame. (Source: Morningstar ) This is not to say that premiums do not occur “often” in CEFs. It is rather regular for eager bidders to push CEFs above their NAV after some unexpected bullish event has occurred. What history tells us about moments like that, though, is that the funds return to their historical trading pattern of NAV discounting because the underlying factors, mentioned earlier, motivating the spread have not changed. Exciting news doesn’t change finance fundamentals – there is no practical reason for an asset to continue to trade above its NAV for an extended period of time – it simply changes the flow of buyers and sellers, which can create a short-term dislocation between ordinary price relationships. How To Play It If one is confident in the continuation of the historical financial relationships such as the ones discussed here, then shorting CUBA is sufficient to manifest that investment view. That would be a mean reversion play and is de facto volatility selling. It makes sense for this situation, considering the recent bout of volatility was caused by an unexpected political event. If one wants to try to arbitrage the relationship, then one would have to buy an approximate basket of weighted equities that CUBA holds and short sell CUBA. Throughout the article I have been saying things like “approximate arbitrage” rather than just arbitrage – that is because there are practical limitations to achieving a pure arbitrage here. While using a mirrored basket of equities limits “risk” in a sense, it is pragmatically problematic and rather cumbersome to do so. One would have to buy ~50 positions and then weigh the individual equities according to the CEF disclosures. To do so correctly one would have to invest a decent chunk of money so as to have a common denominator between individuals positions. There is also the practical problem of information lag – most CEFs report their holdings either quarterly or semiannually. If the fund is actively managed, then one would always have an imperfect basket, regardless of the pains taken to weigh each equity properly. Of course, one could create a basket of Carribbean related assets, and weigh them according to traditional portfolio metrics (as opposed to mirroring CUBA), and assume that the correlation between those two portfolios is “good enough”. In my opinion, short CUBA is “good enough”. Historical norms will return, and CUBA will likely begin to trade at the historical discount of nearly 10% that it has traded at for years. The Opportunity In Summary What happened: Nearly all emerging market closed end funds trade at a discount to their NAV. This relationship is due to EM risk premia and management fees. CUBA is a closed end fund that is currently trading ~10% above its NAV. This premium was recently as high as 50%. The richening of the valuation was catalyzed by President Obama’s announcement of resuming diplomatic relations with Cuba. Expectations: CUBA will return to its historical average discount to NAV of ~8-10%. This leaves about ~20% of juice left in the opportunity. Reasoning CUBA, the CEF, has very indirect exposure to Cuba, the country. This is by no fault of the fund managers – it is nearly impossible (and possibly illegal) to have direct exposure to a communist country that the U.S. forbids nearly all trade with. Therefore, the run up of CUBA was likely a case of benefit-by-association. The political quagmire that is the U.S. congress is highly unlikely to normalize trade relations with Cuba – especially in an efficient manner. This reality will become evident and likely impact Cuba-related equity premiums. Risk premia and relatively high management and expense fees (~2.5% all in) justify a discount to NAV, especially when many of the top holdings in the CEF are easily accessible to U.S. investors. A long CUBA position may be a nice investment one day – basket exposure to the Carribbean is enticing, especially with the long term expectation of Cuban trade with the U.S. However, waiting for the NAV discount to return to initiate such a position is wise, and taking some easy profits while that long-standing relationship returns to normalcy is an appealing opportunity. The downside is nearly non-existent and the upside of 20% makes the opportunity worthwhile. On a closing note, consider this graphic showing emerging market closed end fund discount/premium relationships. See if you can spot the one that’s different. (click to enlarge) (Source: Wall Street Journal ) Additional disclosure: I retain the right to open L/S positions in any equities mentioned.

SPY-TLT Universal Investment Strategy 20 Year Backtest

20 year strategy backtest using Vanguard VFINX/VUSTX index funds as a proxy for SPY/TLT. The strategy uses an adaptive SPY/TLT allocation, depending of the market environment. The strategy achieves 2x the return to risk ratio and a 5x smaller max drawdown than a buy and hold S&P 500 investment. In a previous article ” The SPY-TLT Universal Investment Strategy ” I presented a simple strategy which allowed to obtain an excellent return to risk ratio only by investing in variable allocations to the SPDR S&P 500 Trust ETF ( SPY) and the i Shares 20+ Year Treasury Bond ETF (NYSEARCA: TLT ) allocations. The allocation of the SPY/TLT pair is rebalanced monthly using a modified sharpe formula. For the new month, the strategy always uses the allocation ratio which achieved the highest modified sharpe ratio for a given lookback period. Here the algorithm uses a 72 day lookback period and a volatility factor of 2.5 in the modified sharpe formula: sharpe=72 day return/72 day standard deviation ^ 2.5. Several readers asked me now to present a longer backtest of this strategy. Using the Vanguard Five Hundred Index Fund Inv ( VFINX) and the Vanguard Long Term Treasury Fund Inv (MUTF: VUSTX ) as a proxy to the SPY/TLT ETFs, here is now a 20 year backtest for the UIS strategy. These index funds are only used to do the 20 year backtest. To run the strategy you would still invest using SPY and TLT. You can also use futures (ES/UB) or leveraged ETFs ( Direxion Daily S&P 500 Bull 3X Shares ETF ( SPXL)/ Direxion Daily 30-Year Treasury Bull 3x Shares ETF ( TMF) or Direxion Daily S&P 500 Bear 3X Shares ETF ( SPXS)/ Direxion Daily 30-Year Treasury Bear 3x Shares ETF ( TMV)) instead. This is explained in detail in my previous article. With these two Vanguard funds, this is now one of the rare strategies which can be easily backtested for such a long period. In general however, I think that it is much more important, how a strategy performed after 2008. The market has changed considerably during these last years, and if you would only invest in strategies which can be backtested 20 or more years, then you would have missed most of the investment opportunities of the recent years. For the backtest, I use our QuantTrader software. This software is written in C# and allows to backtest and optimize investment strategies using this sharp maximizing approach. You see the screenshot of the results below. The upper chart shows the VFINX/VUSTX performance. The middle chart shows the allocation with red=treasury and yellow=S&P500. If you look at this allocation, then you see that the market is in fact oscillating between “risk on” bull stock markets and “risk off” bear stock markets (= bull treasury market). Overall, you can say that for buy and hold investors, treasuries have been the better investment for the last 20 years. The sharpe ratio (return to risk) of the VUSTX treasury is 0.79, while the sharpe of the VFINX S&P500 fund is only 0.5. With VFINX/VUSTX combined, the strategy achieves a sharpe of 1.28, which is more than double the return to risk ratio of a stock market investment. This means, that instead of investing 100’000$ in the U.S. stock market, using leverage, you could invest 250’000$ in the UIS strategy. This way you would have the same risk, but you would get 20%-30% annual return. The strategy shows a very smooth equity line and the real max drawdown is well below 10%. The 11.68% drawdown peak measured in 2008 was in fact only an extreme mean-reversion reaction following a near 20% treasury up spike. The max drawdown is more than 5x smaller than a buy-and-hold stock market investment. Personally I think, this is in fact the biggest argument for such a strategy. All together, we had several major market correction like the 2000 tech bubble dot-com crisis, the 2001 9/11 attack, the 2003 Gulf war, the 2008 subprime crisis, the 2011 European sovereign debt crisis and lots of other smaller corrections. The UIS strategy always performed very well during these corrections. From 1995 to 2007, the UIS strategy had quite a stable 12% annual return. After 2008, the UIS return increased to 15% annually. The main reason for this improvement is the increased volatility and momentum factors present in the market. After the 55% correction of the U.S. stock market in 2008, VFINX had a lot to recover the last years. In fact, the normal average growth rate of the S&P 500 is about 9% and not 15% like it was during the last 5 years. The UIS strategy “likes” market corrections from time to time, because then the strategy can profit during the down market from treasuries going up and when the market goes up again, then the strategy can profit a second time from a higher stock market allocation. This way, the strategy can return more than each of the two single ETFs. If you want to check the monthly investments of this strategy, then you can download here the full backtest Excel file: 20 year performance log UIS VFINX VUSTX (click to enlarge) Source: Logical-invest.com

Why Long-Term Investor Over Short-Term

Long-term investing is delayed gratification, whilst short-term is income-orientated. The stock market has averaged 9% per year over the long term. Vanguard has a suitable ETF for long-term passive investors. Bearish signs on the S&P 500 and Gold in the short term, but Gold in the long term looks attractive from here. This is an important question to ask yourself before you invest capital into the markets. “Start with the end in mind” is a good question to ponder over your investment goals. Do you want to be active or passive? Do you want regular income or are you going to leave your money to compound over time? What about day trading? The answer to these questions is going to be different for everyone but they are definitely questions you should ask yourself before you start investing. Let’s discuss some long- and short-term set-ups at present so you can have a better idea on the strategy that suits your personality the best. So what’s your end goal here if you want a career in investing? Well there are 2 extremes. You can learn to become a compounding long-term giant like Warren Buffett or a day trader or even a high-frequency trader where your sole objective is daily income. Long-term investors do their due diligence on multiple companies, and usually hold onto their underlyings for at least 6 to 12 months, if not years, before thinking of liquidating. Day traders and short-term investors, on the other hand, mainly look at charts, moving averages, volatility and sentiment in order to predict short-term direction. Long-term investing brings many advantages. You are not glued to your screen everyday watching for every uptick. Professional investors’ “modus operandi” is to thoroughly research companies and then make their decisions accordingly. This is where the big gains are because you are effectively an insider. You know information about startups that the public doesn’t. If you want to be in this game full time (this being your career), I believe that is the end goal. Nevertheless, not everyone has that sort of time when starting out, so let’s take a look at the steps you could take to get to your end goal faster. Most investors are definitely passive, as there are constraints on their time. This is definitely the best way to start out. There are many vehicles such as (NYSEARCA: VTI ) that average between 8% and 9% before tax annually over the long term. It is very difficult to beat the market when starting out, so this is a good strategy for an investor starting out on their career. Compounding works over time in your favor, and if you start out with a sizeable balance and also add to it regularly, it can turn into a sizeable amount of capital after some time. Every “saver” should adopt this approach as it is extremely difficult to get rich on savings alone. In our 1% portfolio, we have many equities that we will not sell at a loss because we are adopting the above principle. Our chosen equities will at least match the returns mentioned above. Many investors talk about the 2008 crash and how equities lost 50% of their values. However, many quality blue chips recovered and now have much higher prices than 2007. Let’s take a look at 2 of our holdings in our portfolio, Kellogg (NYSE: K ) and Coca-Cola (NYSE: KO ). We are not putting stop losses on these underlyings. Take a look at charts below to see their action over the last 10 years. (click to enlarge) (click to enlarge) As you can see, both companies recovered after the 2008 crash and for good reason. Both companies are leaders in their industries and cash rich. Even when stocks were plummeting in 2008, these companies raised their dividends. Kellogg has now raised its dividend for 10 straight years, and Coca-Cola has done the same for 52 years straight! Both are now yielding just under 3% for shareholders, but the yield was far higher in 2008 as dividends and stock prices converged. These stocks should definitely at least match the stock market going forward. This is why we will never sell them at a loss, as we know they will recover over time . These types of stocks give you a buffer (support) through good fundamentals and increased dividends. Let’s look at Gold also over a 10-year period. Gold has definitely been in a bull run since 2000. Have a look at the chart below of (NYSEARCA: GLD ) (ETF that tracks the price of Gold) to confirm. (click to enlarge) The startling fact is that amidst all the doom and gloom surrounding Gold recently, the precious metal is still up almost 180% over the last 10 years, which beats the stock market by double. With all the easing measures that central banks are adopting at present, Gold should rise from here if the bankers can’t halt deflation in its tracks, so I see no reason for selling Gold now, assuming you are a long-term investor. Nevertheless, let’s now look at short-term outlooks for both the stock market and Gold. Obviously, if the stock market corrects, our selected underlyings will also correct and definitely the stock market is more overbought now than Gold (period of 3 to 5 years). Look at the chart of (NYSEARCA: SPY ) below. As you can see, the S&P has run through its 50-day moving average, but more importantly, the trend line from the October lows last year to the December and January lows have been broken. This should imply downward action in the stock market for the next month or so but the slide may be halted by the upcoming FOMC meeting, which takes place on the 29th of this month. These meetings have acted as support for the market in the past, so I wouldn’t be surprised if the meeting puts a temporary floor under the market yet again later this month. (click to enlarge) Gold in the short term doesn’t look that attractive either. The volume in (NYSEARCA: DUST ) has spiked (see chart). This is an inverse leveraged ETF (x3 in the mining sector), and usually gives good predictions about where the mining sector is going in the short term. (click to enlarge) Also, when you look at the chart of (NYSEARCA: GDX ), you see that the mining ETF has printed a bearish candle in the last few days and the RSI levels are rather high. (click to enlarge) So how do you want to invest?. Do you want to hold through the down moves or sell? (passive or active). You need to answer this question before you start investing. Neither one is right nor wrong but one thing is clear. If Gold goes to the stratosphere, the long-term Gold bulls who own low-cost ETFs or physical will do very well. They have less trading costs, less headaches about short-term movement in price and obviously more compounding of their capital. If you decide you want to be a short-term or swing trader, be willing to invest the time because you will really have to sharpen your technical skills before being able to beat passive investors, but it most certainly is possible. Also nobody talks about the time involved when trading short-term. Passive investors are using that time to make money in other areas or researching other companies. What’s that time worth to passive investors, another 2%, 3%, 5% annually? These are only questions you can answer… Personally, I like to combine both but I always try to veer towards being long-term and fundamentals. Invariably, this means that the income from my short-term investments varies a lot every month, as I give precedence to my long-term goals.