Tag Archives: nreum

Centrica’s Dividend Cut – How Should Shareholders React?

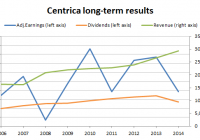
This week I was mildly surprised to see that Centrica ( OTCPK:CPYYF ) ( OTCPK:CPYYY ) (which I’ve owned since 2012) had cut its final dividend as part of a plan to rebase the dividend some 30% below its previous level. It wasn’t a complete surprise given the recent collapse in the price of oil, but it’s the sort of event which demands some sort of reaction. As I see it, shareholders have three main options: Panic sell: Break out in a cold sweat, curse Centrica’s management and place a sell order immediately. Do nothing: Be mildly miffed, but do nothing with the intention of holding the shares “forever”. Weekend review: Wait for the weekend and then review the company again in order to decide whether to keep holding, start selling or perhaps even buy more if the price drops enough. Reaction option 1: Panic sell If you’ve been reading this blog for a while, you’ll know that I am not a fan of panic selling, especially when it relates to an established, successful company like Centrica . Sure, panic sell an AIM-listed micro-cap mining company that operates in some country you’ve never heard of, but Centrica? I’ve written about this before, but in my view panic selling a defensive dividend payer like Centrica is like selling a buy-to-let property because its rental income drops for a year or two. Typically, rent will drop because there’s a void period, i.e. a period where one tenant leaves and another can’t be found immediately. The property sits empty for a few months and so rental income for the year is lower. Panic selling in that situation would mean putting the house up for sale immediately at a knock down price, perhaps 20% below its true market value, just to get rid of the place. To me that is just crazy. It locks in a massive capital loss just because income has dropped a little bit for a little while. The property is still there, its basic ability to generate an income is no different, and in time the income may well bounce back to where it “should” be. The same could easily be said of Centrica or any other defensive dividend payer. The same sort of situation led investors to sell Aviva (NYSE: AV ) after it cut its dividend in 2013, causing them to miss out when the share price rebounded massively shortly after (a roller coaster ride which I went through myself). Reaction option 2: Do nothing Now, this is much closer to my heart. I like to be efficient, i.e. to minimise the amount of work I need to do (which my wife describes as “lazy”). The minimum amount of work in this situation is to simply do nothing at all. In fact, this is a popular strategy which generally falls under the banner of “buy and hold”. A good example of the buy and hold approach is the High Yield Portfolio strategy (HYP) developed by Stephen Bland, which has its spiritual home on the Motley Fool bulletin boards. With HYP, defensive dividend payers are bought with attractive yields and then left untouched for all eternity, and “tinkering” with the portfolio is a definite no-no. While this sounds more attractive to me than panic selling, and is for the most part a fairly sensible strategy if you’re buying the right sort of companies, it isn’t for me. I don’t like the idea that I would buy a company in 2010 and still be holding it in 2030 without ever having thought about whether it was worth holding on to. When a company is first bought, it is analysed to make sure it’s a defensive dividend payer. At the same time, its share price is analysed to make sure the yield is sufficiently good. So, if it makes sense to check those things when the shares are bought, why does it make sense to never check them again? What if the company goes down the pan, never to recover? Surely, at some point it makes sense to move on and buy another company that is far more successful? Or what if the company does okay, but the share price doubles or triples, dropping the dividend yield to well below the market rate? Wouldn’t it make sense in that case to lock in those excess capital gains by selling? The proceeds could be reinvested into another, equally solid company but with a more attractive valuation and dividend yield? That’s not to say buy and hold isn’t a good strategy. It can be, but only for those who really do never ever want to make any investment decisions ever again, or at least no more than once every few years. For me that is far too boring and leaves far too many potential returns on the table. So, while I think doing nothing is probably much better than panic selling, I’m not going to stick with Centrica forever and ever, regardless of how it performs. I want something in between those two extremes. Reaction option 3: Weekend review And so we come to my preferred approach, which is the weekend review. The idea with a weekend review is to take the middle path between an emotionally driven knee-jerk reaction on the one hand and a complete absence of reaction on the other. It may seem odd to wait for the weekend, but there are good reasons for doing so: The markets are closed so you can’t see the price ticking lower ever few seconds and you can’t execute a trade immediately, which means you can concentrate on doing a good review without distraction It will usually be a day or so since the original unpleasant results were announced so you will have had time to calm down (although if you get upset by bad news, you’re probably not diversified enough), which should help you to think more clearly Once the weekend rolls around you would just sit down and do a thorough review of the company (Centrica in this case) using its latest results and its latest share price (using this investment spreadsheet if you like). In my case, as a defensive value investor I would be looking to see: Defensiveness: Is Centrica still a relatively defensive dividend payer (despite the dividend cut), with reasonable medium- and long-term growth prospects? Value: Is the valuation still attractive, given the company’s slower growth rate and reduced dividend? Here are Centrica’s results up to and including the dividend cut: The profits are a bit jerky but the general trend is upward, although of course there are no guarantees for the future. At 255p, the company and its shares have the following metrics, which I have compared against the FTSE 100: Growth: 10-year revenue/earnings/dividend growth rate = 8% (FTSE 100 = 1%) Quality: 10-year growth quality (consistency) = 79% (FTSE 100 = 54%) Value: PE10 ratio (price to 10-year average earnings) = 11.3 (FTSE 100 at 6,850 = 14.4) Income: Dividend yield = 4.7% (FTSE 100 = 3.4%) Profitability: ROCE = 12.4% (using post-tax profit) (FTSE 100 = 10%) By those metrics, the company still has a better track record than the market average and its share price is still more attractively valued than the market by a considerable margin. After looking at the numbers, I reviewed the company’s operations and its market, and I think it is by no means clear how Centrica will perform in the medium to long term. The oil price is uncertain, the political situation is uncertain, and the economy is uncertain. However, this degree of uncertainty is entirely normal as the future is almost always uncertain. Rather than try to predict an uncertain future, my approach is to defend against it instead. I think the best way to defend against an uncertain future is build a highly diversified portfolio of successful, established, dividend paying companies, and then for the most part to let them get on with it. On that basis, I will be holding on to Centrica for now, despite the dividend cut. Editor’s Note: This article discusses one or more securities that do not trade on a major exchange. Please be aware of the risks associated with these stocks.

Duke Energy – FY 2014 Results And Future Guidance Takeaways

Summary Expected EPS growth in 2015 ($4.55-$4.75) from $4.55 in 2014. Expected EPS growth of 4-6% through 2017. Commitment to dividend and maintaining a strong balance sheet. Potential risks include exposure to Brazil, decreased residential energy usage, and volatile oil prices. Duke Energy’s Q4 Earnings Call On February 18, 2015, Duke Energy Corporation (NYSE: DUK ) reported their fourth quarter and full year 2014 earnings. Within the earnings call, the company identified four financial objectives for 2015 and beyond within their presentation: (1) Current Year earnings guidance, (2) Long-term earnings growth, (3) Dividend growth, (4) Balance sheet strength. In this article, I will review these four financial objectives and provide an outline and analysis on the company’s projections. Refer to the company’s earnings call transcript and power point for additional details. Expected EPS Growth in 2015 In 2014, the company achieved an adjusted diluted EPS of $4.55, which fell in the range of the original guidance ($4.45-$4.60) and the revised guidance ($4.50-$4.65). The guidance range for 2015 earnings guidance is $4.55-$4.75. Key assumptions for 2015 in obtaining this estimate are: Capital expenditures falling within the range of $7.4-$7.8 billion in 2015. This represents a moderate increase of 35% to 42% from the $5.5 billion in 2014. This increase is a positive sign for the company in the future as they make commitments to pursue alternative energy generation sources to decrease their financial dependency on crude oil prices. Retail load growth of 0.5-1.0% in 2015. This range has been reached each year since 2012 (0.6% in 2012, 2013, and 2014). This will be a key metric to monitor throughout the year as the company experienced a difficult year for residential sales in 2014. The company experienced a 0.1% decline in weather-normalized residential sales, but the decline was much worse in Q4 2014 specifically where they experienced a 2.2% decline. 700M average shares outstanding as of 12/31/2015. This shouldn’t be a difficult metric for the company to achieve as they had 707M outstanding as of 12/31/2014 with no planned equity issuances through 2017. $65 per barrel average Brent crude price for 2015. This is a hard assumption to question as oil has become a major battleground and everyone has a different opinion on the future price of oil. I expect that oil inventories will continue to rise and prices will continue to decrease in 2015. Based on the February 2015, EIA report, Brent crude oil prices are expected to be $57.56 in 2015. Exchange rate of approximately 2.85 BRL/US$ (2.35 in 2014). Again, like oil, this is a hard assumption to question, but the BRL/US$ exchange rate has seen a relatively steady increase since September 2014 and I expect this to continue as the Brazilian economy struggles and the US economy strengthens in 2015. Expected EPS Growth Past 2015 In addition to achieving 2015 adjusted diluted EPS guidance, the company is striving for per share growth of 4-6% through 2017. The key growth drivers in this per share growth are: Retail load growth of 1% going forward. Based on the analysis above, the company has been stagnant with a 0.6% retail load growth from 2012 to 2014. I think it is going to be very difficult for the company to achieve a 1% growth going forward. I think it is going to be difficult to achieve because of the lower energy usages in homes. I don’t see this trend reversing and allowing this 1% growth rate to be achieved. The company expects total wholesale net margin to increase due to the new 20-year contract with NCEMC at Duke Energy Progress (began in 2013) and 18-year contract with Central EMC at Duke Energy Carolinas growing to a load of 900MW in 2019 from 115MW in 2013. FY2015’s total wholesale net margin is expected to be approximately $1.1 billion with an anticipated 5% compound annual growth rate. Regulated earnings base growth is expected to follow the $2 billion growth trend in 2015 that was seen in 2014. Commitment to Dividend and Maintaining a Strong Balance Sheet In 2014, the company paid out a dividend of $3.18 per share with that amount expected to rise to $3.24 per share in 2015 (almost 2% increase year-over-year). With the company achieving a payout ratio close to 70% and management’s commitment to paying out a quarterly dividend to investors, I do not see the company’s current 4% dividend yield to be at risk. Management has paid 89 consecutive years of dividends with increases coming the past 7 years. This is largely possible due to the company’s strong balance sheet and no planned equity issuances through 2017. In addition, the company announced a strategically tax-efficient way to repatriate $2.7 billion back to the U.S., which will help fuel the dividend increases going forward. 3 Potential Risks The exposure to Brazil is a significant risk for the company’s future, which was seen in the 2014 financial results. In 2014, there was a decrease in sales volume as well as higher purchased power costs due to the interruptions in the hydrology production. Per the earnings call, they are assuming normal hydrology despite the rainy season starting slowly. Brazil is a major story to follow for Duke Energy in 2015 and beyond as the company is predicting EPS growth from this business segment despite recent downward trends in profits there as well as the Brazilian economy. I think the company will have difficulty increasing the retail load growth to 1% given the increased technologies and social initiatives to decrease electric use. Oil prices will continue to be a wild card going forward. Forecasting a price on such a volatile asset is a difficult task. If oil prices continue to fluctuate widely, it will significantly impact the company’s bottom line. Conclusion: Duke Energy Corporation faces some difficult obstacles including a slowing Brazilian economy, lower residential energy usage, and volatile oil prices; however, I believe that the company gave conservative and very obtainable estimates in each of the key assumptions used to allow them to meet their financial objectives for FY 2015 and beyond. While I don’t see Duke Energy being a rapid growth story going forward, I do believe they have the ability to present slow stock appreciation with the safety of a consistent dividend. Disclosure: The author is long DUK. (More…) The author wrote this article themselves, and it expresses their own opinions. The author is not receiving compensation for it (other than from Seeking Alpha). The author has no business relationship with any company whose stock is mentioned in this article. Are you Bullish or Bearish on ? Bullish Bearish Neutral Results for ( ) Thanks for sharing your thoughts. Submit & View Results Skip to results » Share this article with a colleague

Oil Services Firms: Hardest Hit; Deepest Value?

By John Gabriel One of the hardest-hit groups in the oil patch may also represent the deepest value for intrepid investors with the stomach to withstand continued volatility during the next year or so. According to the aggregated fair value estimates of Morningstar equity analysts, Market Vectors Oil Services ETF (NYSEARCA: OIH ) is currently trading at an 18% discount. While oil services firms represent attractive long-term values, they could still be in for more rough sledding during the next 12 to 18 months as the oil markets have yet to settle into equilibrium. Given the current state of excess supply and slowing demand from key consuming markets like Europe and China, a snapback recovery in oil prices doesn’t seem very likely. Drillers and exploration firms have reacted to the sharp drop in crude-oil prices with aggressive cuts to capital expenditure budgets in 2015. But U.S. production is still poised to increase this year thanks to efficiency gains and many wells continuing to operate because of contractual obligations. The U.S. Energy Information Administration’s latest weekly petroleum status report (which can be found here ) revealed higher-than-expected inventory levels. Unfortunately, it is not as simple as turning the oil spigot on or off. Hence, the potential 12- to 18-month timeline for energy markets to stabilize. Of course, there are still many uncertainties on both sides of the equation. Saudi Arabia is adamant in maintaining its current production levels in the interest of protecting its market share. Production cuts from the region in the future would likely bolster oil prices as excess supply is removed from the market. The demand side hinges largely on the economic growth prospects from key consuming regions. Investors who have a positive outlook on energy prices and the expansion of drilling operations might consider OIH as a tactical satellite holding. This exchange-traded fund tracks firms that provide the rigs and crews needed to drill some of the world’s deepest and most challenging offshore wells. Investors should bear in mind that the drilling and oil-services industry can be cyclical, as rig demand is based on customer expectations around commodity prices. Given its extremely narrow focus, this ETF should be limited to a small complementary position in a diversified portfolio. Unlike large vertically integrated oil companies Exxon Mobil (NYSE: XOM ) and Chevron (NYSE: CVX ) , the companies held by this fund are highly subject to the capital-spending cycle of the industry, because the bulk of their revenue is generated while companies drill new wells. The investment thesis for taking a stake in OIH is likely motivated by the fact that the incremental barrel of oil being produced is increasingly coming from areas (deep water, oil shale, the Arctic) that demand more services expertise and technology. Such a dynamic supports healthy long-term industry trends and pricing power. However, prospective investors should also keep in mind that oil-services firms do tend to move in a somewhat outsized fashion depending on which way the economic winds are blowing. That said, conviction in a longer-term fundamental thesis should help investors hold on through what is likely to be a bumpy ride. To illustrate how volatile the fund can be, consider that during the trailing five-year period, the Dow Jones U.S. Oil Equipment & Services Index (an industry benchmark) experienced a standard deviation of returns of 28%, compared with the S&P 500’s standard deviation of 13%. During the same period, the standard deviation of returns for the broader energy sector (represented by Energy Select Sector SPDR (NYSEARCA: XLE ) ) and the price of oil itself (represented by United States Oil (NYSEARCA: USO ) , an ETF that tracks rolling front-month crude-oil futures contracts, an admittedly basic but investable proxy) were 20% and 26%, respectively. Finally, in terms of potential diversification benefits, we’d highlight that OIH has been moderately correlated (55%) with the S&P 500 during the past two years. Fundamental View The oil-services business can be unforgiving at times, thanks to the cyclicality of commodity markets. Energy behemoths like Exxon Mobil and Chevron gauge their exploration and production needs based on the price of crude-oil. As crude prices rise, these oil majors expand drilling operations, spurring demand for rigs and related services, and vice versa. Thus, crude prices and related expectations, rather than secular factors, act as the fulcrum for oil-services demand. The widespread adoption of horizontal drilling and hydraulic fracturing in North America has proved to be a game changer for global energy markets, and “peak oil” concerns have been consigned to the history books. But inexorable growth in domestic oil production has a downside. Lethargic global demand growth is no longer keeping pace with supply, and OPEC is no longer willing to sacrifice production to maintain higher prices. The takeaway for independent E&P companies in North America is that the recent slump in crude prices may not be fleeting. As a result, capital expenditures could be meaningfully reduced across the sector in 2015. Several exploration and production firms have already cut their budgets, and the rest of the companies in the industry are likely to follow suit. Although only a handful of companies have disclosed their capital expenditure plans so far, U.S. companies expect to spend around 20% less than 2014 on average, with multiple companies planning to slash spending by around 50%. Such cuts could be a significant drag on exploration and production companies, as reduced spending defers cash flows and weighs on valuation. The impact would be exacerbated for the oil equipment and services stocks that make up the fund’s portfolio. Looking back to the 2009 crash as a proxy indicates that a 20% drop in capital expenditures by exploration and production companies would reduce operating income for the equipment and services companies by more than 30%. As a cap-weighted portfolio, OIH is more heavily skewed toward the large firms that dominate the industry, such as Schlumberger (NYSE: SLB ) and Halliburton (NYSE: HAL ) . But OIH’s concentration isn’t necessarily a bad thing. A two-decade-long bust has consolidated services and equipment expertise within very few companies–the same firms that make up the bulk of OIH’s assets. These are the firms that operate with sustainable competitive advantages, or economic moats. The behemoths that sit atop OIH enjoy bargaining power thanks to their huge research and development budgets and technology-acquisition strategies. Producers have little leverage over equipment and services firms that have built low-cost and dominant positions through decades and hundreds of acquisitions. Still, the recent collapse in oil prices will challenge the fund’s constituents in the near to intermediate term. Even if all exploration and production companies announce significant reductions in their capital expenditures, there is not likely to be an immediate production rollover that would help oil prices recover. For instance, the firms that have already announced lower budgets for 2015 are still anticipating 20% production growth on average for the year. Driving production growth is ever-increasing drilling efficiency and existing rig-contract obligations. Portfolio Construction The fund invests no less than 80% of its assets in the constituents of the Market Vectors US Listed Oil Services 25 Index. The index identifies the largest 50 firms in the oil-services sector by full market capitalization and includes the top 25, as measured by free-float market cap and three-month average daily trading volume. Because it weights its holdings by market cap, the fund has a relatively concentrated portfolio. Top holding Schlumberger alone makes up about 20% of assets, and the top 10 holdings represent roughly 71%. Firms domiciled in the U.S. make up the lion’s share of the fund at about 82% of the portfolio, with the remainder of the portfolio composed of European companies. Large-, mid-, and small-cap companies represent 49%, 43%, and 8% of total assets, respectively. The portfolio’s holdings-weighted average market cap is about $16.5 billion. Fees OIH levies a 0.35% annual fee, which is reasonable considering its narrowly focused theme-based approach. Alternatives The closest alternative to OIH is iShares U.S. Oil Equipment & Services (NYSEARCA: IEZ ) , which charges a 0.45% annual fee. It holds roughly 50 stocks and weights its holdings by market cap. The fund is also top-heavy, as its top 10 names comprise about 64% of assets. We believe the three largest firms within the industry do maintain competitive advantages over the rest of the lot, so we view IEZ’s concentration as a benefit. That said, OIH, which is also very concentrated, is cheaper and far more liquid. In terms of market cap, OIH and IEZ have about 80% of their portfolios in common. Another option is SPDR S&P Oil & Gas Equipment & Services (NYSEARCA: XES ) , which charges an expense ratio of 0.35%. XES is an equal-weight portfolio of about 50 oil-services firms, so each holding makes up around 2% of the portfolio at each quarterly rebalance. That means the industry leaders are shoulder to shoulder with the second- and third-tier players. While equally weighting holdings helps avoid heavy concentration in a few firms, it also means that the industry’s best names hold significantly less sway. The prominence of the space’s smaller marginal players could result in even higher volatility. For broader exposure to the entire energy patch, investors could also consider Energy Select Sector SPDR, Vanguard Energy ETF (NYSEARCA: VDE ) , and Fidelity MSCI Energy (NYSEARCA: FENY ) , which charge 0.15%, 0.12%, and 0.12% per annum, respectively. Along with holding the vertically integrated supermajors, these funds also maintain sizable exposure to oil services and refining, as well as exploration and production companies. Disclosure: Morningstar, Inc. licenses its indexes to institutions for a variety of reasons, including the creation of investment products and the benchmarking of existing products. When licensing indexes for the creation or benchmarking of investment products, Morningstar receives fees that are mainly based on fund assets under management. As of Sept. 30, 2012, AlphaPro Management, BlackRock Asset Management, First Asset, First Trust, Invesco, Merrill Lynch, Northern Trust, Nuveen, and Van Eck license one or more Morningstar indexes for this purpose. These investment products are not sponsored, issued, marketed, or sold by Morningstar. Morningstar does not make any representation regarding the advisability of investing in any investment product based on or benchmarked against a Morningstar index.