Tag Archives: marketplace

Using ETFs To Short The Market

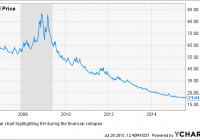
Summary The structure and pricing of inverse and leveraged ETPs is complicated. The principal investments of this fund are money market instruments and derivatives. Daily re-balancing can be a concern. Reading through recent Seeking Alpha articles regarding the broader market, lengthy and often heated discussions tend to develop on the direction of the market. That being said, it seems as if opinions on the eventual breakthrough of the current sideways trading range are about half and half, with maybe slightly more bulls. I also recently read comments on an article about leveraged and inverse exchange-traded products, where many readers did not seem to have a clear understanding of how (particularly) inverse ETPs are priced. In light of these two observations, I thought it pertinent to analyze how an inverse ETF is structured, for the benefit of investors who are considering investing in one in order to profit from potential downside movement. Due to the referenced uncertainty and volatility present in the overall market, I decided to use the ProShares Short S&P 500 ETF (NYSEARCA: SH ) as the subject matter for my analysis. SH is an inverse ETF that attempts to return -1x the return of the S&P 500 on a daily basis. How does it achieve inverse returns? SH achieves returns that are inversely correlated to the S&P 500 by investing in assets and derivatives that perform (or historically perform) well when the market is not performing well. There are four main investments used by ProShares in its inverse index ETFs, and these are: Swaps (derivative market) Futures (derivative market) U.S. Treasury Bills (money market) Repurchase Agreements (money market) Derivatives : The sale of swaps will benefit in a falling market, because the buyer of the swaps is required to pay the seller the amount that the underlying has fallen in price. Inverse exposure through futures is likely most often achieved by short-selling index futures. Money Market Instruments : The use of short-term Treasuries and other money market instruments relates to the fact that short-term debt historically performs inversely to the market. This is due to there being a “flight to safety” when the equity markets are falling. Daily Re-balancing: For periods longer than a single day, the Fund will lose money when the level of the Index is flat, and it is possible that the Fund will lose money even if the level of the Index falls. – SH Prospectus The effect of daily rebalancing is one of the primary misunderstandings regarding inverse or leveraged ETFs that I see on Seeking Alpha. People discuss how they will “invest” in a leveraged ETF and hold it for several weeks, months, or even years in some instances. It is important to recognize that this is not the intended purpose of this type of ETF. These are intended to be traded for short time periods. In order to maintain the proper leverage ratio, inverse returns, and index exposure, SH is rebalanced each day. What this means for an investor is simple to illustrate: Suppose that at the end of the trading day on Monday, you invest $1,000 in a -1x inverse ETF @ $100 per share. The ETF tracks an underlying index with a value of $5,000. At market close on Tuesday, the index has decreased 10% to $4,500. In turn, the ETF has risen 10% to $110. By the close on Wednesday, the index has recovered to the original $5,000 – a roughly 11.11% gain. In turn, the ETF now loses 11.11%, which brings the value of your position to $97.78. Even though the index is exactly the same value as it was when you initiated the position, your position has lost money. This effect is also known as beta slippage. Note: This could theoretically work to your advantage, should the opposite situation occur. Conclusion: Simply by looking at a chart of SH, you will see that if you had held it for the duration of the 2008 collapse, you would have indeed profited: ND data by YCharts However, the return ratio was not accurate, with SH gaining approximately 26.07% from 1st January, 2007 to the first peak and SPX losing approximately 43.25% in the same time frame. In short, an inverse ETF like SH can be a great way to hedge short-term volatility or for intra-day trading, but if an investor is looking to actually short an asset (in this case, the S&P 500) for a long-term position, then it is not the most effective way to do so. Hopefully, with a clearer understanding of how this ETF is structured, prospective investors can make better use of it as a tool for his or her portfolio. Disclosure: I/we have no positions in any stocks mentioned, and no plans to initiate any positions within the next 72 hours. (More…) I wrote this article myself, and it expresses my own opinions. I am not receiving compensation for it (other than from Seeking Alpha). I have no business relationship with any company whose stock is mentioned in this article. Additional disclosure: This article is not intended to offer a recommendation to buy or sell any particular asset, and does not reflect the author’s opinions on the direction of the market. It is simply intended to provide an overview of how a complicated but useful financial instrument works.

SCHZ: A Remarkably Complete Bond Fund

Summary I’ve been looking for some medium to high quality fixed income investments. My preferred method of making the investments is buying ETFs. I want something with decent yields, excellent internal diversification, and reasonable or better levels of liquidity. I would accept some credit risk or some duration risk to increase yields, but expense ratios have to be low. SCHZ offers investors an incredibly diversified portfolio of fixed income investments and I may use it from time to time. Since the Schwab U.S. Aggregate Bond ETF (NYSEARCA: SCHZ ) is a Schwab ETF it is eligible for free trading in Schwab accounts. Since I want to be able to use my bond ETF as a place to park cash and earn some yield off of it, I want that free trading to move money in and out. With an expense ratio of only .05% (not a typo), I’m very impressed with this ETF. To be fair, the largest factor in my decision to open accounts with Schwab was the free trading on low fee ETFs. It shouldn’t be surprising that I like several of their funds since I picked them as a brokerage after I glanced at their ETF offerings. The Good The portfolio offers an absolutely remarkable diversification of fixed income investments. Investors are getting exposure to treasury securities, mortgage pass-thru securities, and corporate bonds. There are even small allocations to non-us corporate debt, municipal bonds, and other small sections of the market. For a fixed income investor looking for one stop shopping for a bond ETF, this is probably one of the best options on the market. The average volume is running around 170,000 shares per day which is enough liquidity to avoid any major concerns. The average yield to maturity is running 2.46%. Given the low interest rate environment we are facing at a macroeconomic level, this is pretty reasonable. All fixed income investors would love to see higher yields on their investments, but 2.46% is solid compared to any similar alternatives. The effective maturity is over 7.3 years and the effective duration just over 5.3 years. That level of duration risk is fairly reasonable for matching my risk tolerance. If yields were higher on a macroeconomic level, I would be willing to tolerate more duration risk. The Bad While the portfolio is a strong contender for one stop shopping, as an mREIT analyst I can’t stomach paying NAV for an investment containing MBS. I can acquire my MBS exposure at a substantial discount to NAV, though I must admit that when buying mREITs I am effectively paying a much higher expense ratio. Regardless, when mREITs trade at huge discounts to NAV, I don’t want my portfolio to include any exposure to MBS where I am paying NAV. I expect that within the next few years we will see fair values for MBS take a meaningful hit. I want that expectation priced into my investment. Overall, holding MBS is not a bad thing. If mREITs were trading at a premium to book value, I would happily be buying into an ETF that trades around NAV and holds the same securities. When mREIT share prices and book values align, I’ll be tempted to make SCHZ a portion of my investment portfolio. It is a solid ETF that is hampered only by the fact that investors have the opportunity to buy MBS exposure at a discount to NAV. The category for “Mortgage Pass-Thru” is currently weighted at 28.9% of the portfolio. This comes in second for weightings with U.S. Treasuries over 36%. The third category is U.S. Corporate with a weight just over 21%. Interesting Notes I tend to be a buy and hold investor with the exception of being willing to do some trading in microcap securities when I think a lack of coverage is allowing prices to deviate from intrinsic value. When it comes to a bond ETF, I want to be able to rapidly move money in and out and of the investment so it functions as a cash fund. I find it interesting that the portfolio turnover is 74% for the Schwab U.S. Aggregate Bond ETF. Frequently I see high portfolio turnovers with excessively high expense ratios, but here the expense ratio is incredibly low. I don’t mind the portfolio turnover since there is no high expense ratio. My problem is not an issue with frequent trading in an ETF; I simply don’t want to pay for it. If it is free, that is fine with me. Conclusion The Schwab U.S. Aggregate Bond ETF is an exceptional bond fund with a low expense ratio and great internal diversification. The only thing that keeps from selecting it as a fixed income investment is that I’m trying to avoid buying MBS at NAV when I cover mREITs and feel confident that I can select solid mREIT investment options on my own. I want to use the diversified low fee ETFs for everything else. When mREITs see share prices and NAVs align, SCHZ will be a very strong contender for use as a fixed income investment or for parking cash while I wait for other opportunities in equity investing. I feel the market is a little frothy and I’m looking to shift my portfolio to have slightly less risk to a downturn in the equity markets while still making enough money off yields to offset inflation. This ETF does both of those things, so the exposure to MBS is the only reason I’m not using it right now. Disclosure: I/we have no positions in any stocks mentioned, but may initiate a long position in SCHZ over the next 72 hours. (More…) I wrote this article myself, and it expresses my own opinions. I am not receiving compensation for it (other than from Seeking Alpha). I have no business relationship with any company whose stock is mentioned in this article. Additional disclosure: Information in this article represents the opinion of the analyst. All statements are represented as opinions, rather than facts, and should not be construed as advice to buy or sell a security. Ratings of “outperform” and “underperform” reflect the analyst’s estimation of a divergence between the market value for a security and the price that would be appropriate given the potential for risks and returns relative to other securities. The analyst does not know your particular objectives for returns or constraints upon investing. All investors are encouraged to do their own research before making any investment decision. Information is regularly obtained from Yahoo Finance, Google Finance, and SEC Database. If Yahoo, Google, or the SEC database contained faulty or old information it could be incorporated into my analysis.

Unloved In The Marketplace, Savvy Senior ‘Income Growth’ Portfolio Increases Cash Flow Payout

“Total return” results have been nothing to brag about for this author and many others focused on income and dividend investing in recent months. But through re-investing and compounding, my 10% yielding portfolio has increased its income flow by 14.7% from a year ago. In other words, the “income factory” continues to expand its output, even while the factory itself has seen its market price drop, making re-investment even more attractive. I would worry if I thought the income factory were worth less in an economic sense, but it is not. A lot of what is spooking markets these days (the Fed, Greece, Puerto Rico, inflation) is just noise. From a total return standpoint, it has been a tough first half in 2015 for many dividend-focused investors, including me. Fortunately, I focus on what my “income factory” produces, and not how the market values it from day to day or month to month. From that standpoint, the news is positive since “factory output” (i.e. income) continues to increase steadily, and I can re-invest that output in additional machines (i.e. income-producing assets) at bargain prices. To be specific, the cash income my factory produced for the first 6 months of 2015 was up 14.7%, higher than the cash income it generated during the first six months of 2014. The six-month cash yield was 5.1% (10.2% annualized) versus a total return that was just barely positive at 0.2%, so without the cash distributions, the return would have been a negative 4.9%. In a practical sense, having a 10% dividend stream that I can re-invest in assets that have essentially been “on sale” for the past nine months is a great opportunity and accounts for my income stream increasing at the rate it has. Since the end of the quarter (June 30), market values have dropped even more, so my current total return year-to-date as we go to press is a bit lower (minus 1%). I mention this in order to compare it to a few useful benchmarks that also report on a year-to-date basis: · Vanguard Dividend Appreciation ETF (NYSEARCA: VIG ): YTD total return of 1.6%, with a yield of 2.24% · Vanguard High Dividend Yield ETF (NYSEARCA: VYM ): YTD total return of -1%, with a yield of 3.26% · ProShares S&P 500 Dividend Aristocrats ETF (NYSEARCA: NOBL ): YTD total return of -.27%, with a yield of 1.85% · SPDR Dividend ETF (NYSEARCA: SDY ): YTD total return -2.32%, with a yield of 2.37% · Vanguard Wellesley Income Fund (MUTF: VWINX ): YTD total Return of -0.4%, with a yield of 2.7% · Vanguard Wellington Fund (MUTF: VWELX ): YTD total return of 1.05%, with a yield of 2.4% In short, it’s been a tough quarter for balanced fund or dividend growth type investors, with mostly flat or slightly down results. The poor total returns are offset, of course, by the ability to compound dividends. But that’s limited if you’re only earning 3% or 4% yields like so many “dividend growth” portfolios. That’s why I’m pretty satisfied at this point with my “income growth” strategy (that many readers are familiar with from past articles, like this one , and this one ) that focuses on growing the income stream through compounding high cash distributions (8-10% or so), and does not rely on organic growth (dividend increases) or market value appreciation. The potential “fly-in-the ointment” in a strategy like mine would be if the decline in market value were a genuine signal of a drop in the income generating potential of a particular asset. So we have to ask the question: · Is the current drop in prices, especially for high-yielding assets like utilities, high-yield credits, and leveraged closed-end funds and other vehicles, a sign that the high yields these assets generate are in jeopardy? · Or are they more a reflection of the “nervous Nelly” quality of the equity markets, where concerns about various issues can translate into selling pressure in unrelated markets and asset classes. I subscribe to the “nervous Nelly” view and believe that markets are seeing negatives that don’t actually exist or are not relevant to the high yield and leveraged markets. Some examples: · Concern about Janet Yellen and the Fed raising interest rates. First of all, when the Fed finally does raise rates, it is likely to only be 50-100 basis points, if that. While that may send a signal that the economy is “normalizing” and that the artificially low interest rate era may be ending, it is hardly enough to hurt leveraged closed-end funds or most other leveraged vehicles. So a closed-end fund that is borrowing at 1% will now have to pay 1½% or 2% instead. If they are using the money to invest in loans, bonds or preferred stock, etc. paying 5%, 6%, 7% or more, it is still a good deal. Meanwhile, the rates on what they are buying will likely go up as well. · All bonds are not created equal. Rising interest rates tend to hurt long-term, fixed-rate, government and investment grade corporate bonds. That’s because these bonds have a relatively high duration and most of the interest coupon an investor receives is payment for taking interest rate risk, not credit risk. High yield bonds, leveraged loans and many other high-yielding instruments often have shorter durations and the coupon represents payment for taking credit risk, not interest rate risk. The irony is that many of these assets actually do better when interest rates increase because the rising rates are a sign of an improving economy, which tends to improve credit performance. Credit performance, rather than interest rate risk, is the main factor in portfolio performance of high-yield bonds and loans. (Loans, by the way, are floating rate, so they have virtually no interest rate risk at all). · Concerns about inflation. In general, I do not see inflation as a medium- to long-term threat the way it was 30 years ago. The main reason is the globalization of our economy, including labor markets. Merely living in a developed country no longer guarantees you a developing country level wage anymore, now that companies can move jobs – actually and virtually – all over the world. This will continue to keep wage inflation down in the United States for years to come. This in turn will have a moderating effect on interest rates. · Other negatives – China’s stock market meltdown, Greece’s economic and political problems, Puerto Rico’s insolvency – may make headlines but are unlikely to affect the ability of the companies in our various fund portfolios to meet their obligations and maintain those funds’ cash flows. So those are the various negatives that I’m NOT particularly worried about. On the positive side, I am happy that the economy continues to make steady forward progress. I don’t need it to race ahead, since I’m not looking to the stock market to appreciate for my strategy to work. I just want the hundreds or thousands of companies whose stock, bonds, loans and other securities are owned by the dozens of funds that I own to keep on paying and continuing to provide the cash flow that my funds distribute. I have not changed my basic portfolio much at all from three months ago, and you can see it in my April article here . A few tweaks included: · Selling off a portion of my Cohen & Steers CEF Opportunity Fund (NYSE: FOF ) when it reached a market high a few months ago. It’s a great fund, and I’ve been buying back in now that it’s at a lower price point and yielding 8.7%. · Started adding Babson Capital Participation Investors (NYSE: MPV ) as a solid “buy once, hold forever” sort of investment. It has been managed by Mass Mutual Insurance since 1988, with an average annual return over that time of over 10%. It holds “private placements” which are the fixed income “bread and butter” of the insurance industry, and Mass Mutual is a long-time professional at it. The shares sell at a 9.7% discount, well below its typical 4% discount, and it pays a distribution of 8.6%. · Added to Reaves Utility Income Fund (NYSEMKT: UTG ) as its price came down and yield went back up to 6.25%, which is high for this excellent fund that many of us here on Seeking Alpha have liked and held for many years. · Added to Duff & Phelps Global Utility Income Fund (NYSE: DPG ); good solid holding in the utility sector; great opportunity right now at almost 14% discount, 8.2% yield. · Added to Blackstone/GSO Long-Short Credit Income Fund (NYSE: BGX ); good solid floating rate loan fund at 14% discount with 7.6% yield; excellent managers. I continue to watch some of my higher volatility holdings like a hawk. Oxford Lane Capital (NASDAQ: OXLC ) and Eagle Point Credit Company (NYSE: ECC ) continue to bounce around price-wise, but still make their regular distributions, with yields of 16.7% and 11.8%, respectively. They both are challenging to analyze and understand, but the bottom line is that both seem to have plenty of cash flow (which in their world of CLO investing is different than GAAP income) to make their dividend payments, so I am happy to have them in my portfolio. All my high-yield bond funds are underwater, but for reasons mentioned earlier in the article, as an asset class they seem to be in no economic danger of not being able to meet their distributions, so I am inclined to hold them. In fact, the improving economy should help them. If I were not already an investor, I’d be buying into the asset class, just as I did in 2008 and 2009. (When there’s blood in the streets, you buy, right?) That’s about it. “Steady as you go,” is my mantra. Keep re-investing those dividends. Disclosure: I am/we are long BGX, MPV, UTG, ECC, OXLC, DPG, FOF. (More…) I wrote this article myself, and it expresses my own opinions. I am not receiving compensation for it (other than from Seeking Alpha). I have no business relationship with any company whose stock is mentioned in this article.