Tag Archives: management

Don’t Rely On Your Emotions To Trade The Oil Patch
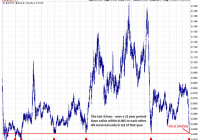
An inflection point has been reached in oil’s valuation per barrel. The Oil/Gold ratio at this level has historically confirmed a trend change. The supply/demand news cycle is beginning to turn. (The Oil/Gold Ratio: click to enlarge) The first thing one sees in the chart (above) is an almost perfect symmetry, with each low point occurring early in Q1 on the red line (excepting 1986, 88, 89). It begs a question for the curious: Under what previous economic conditions did the oil/gold ratio reach today’s extremes? What is the correlation in barrels per oz. of gold?” “How far into this drop are we currently?” We are at Financial Crisis lows (2008-09); and the deep devaluations of the late-1980s are the only levels remaining to be pierced. The oil/gold ratio has been at this level three times in the last two decades, and each time it rallied. The current comparison clocks in at $45/bbl. How cheap is oil? Early this morning you could buy 28 barrels of oil with a single oz. of gold, the most in the modern era (excepting 1988). I am using the price of gold to value a barrel of crude because gold is a storage of value. Oil is a cultural commodity and the substrate of modern industrial society. In terms of financial comparisons, gold retains its value, oil we use ubiquitously. The ratio measures the cost of that use. Observe the parabolic surges in the chart below. Excepting the go-go years of impossibly cheap oil (1986 and 1989), each one of these telephone-pole tops flamed-out quickly. (click to enlarge) If zoomed-in for a closer look (below), you can see that the final weeks of the surge (red boxes) were composed of unsustainable, soaring price-gaps. For example, an ounce of gold this morning could buy you 33% more oil than on January 1, 2015, less than 3 weeks ago; or 60% more oil than in November, 2014! Is this any way to price a commodity that’s used 91ML bbl a day? In just the last week we have had several 5% up and down days close-by in sequence, resulting in single-session half-trillion dollar gains or losses for crude oil. This kind of price discovery only occurs near turning-points – when the market can’t figure out what something is worth – when all the news and analysis is clouded in total confusion – and hence the focus of this article. For ages, if you wanted to figure out what something was worth, you compared it to gold; and at this point, oil is as cheap as it gets. (click to enlarge) In my previous articles, I have used a pressure-cooker model to scale into positions through dollar-cost averaging, buying at gradual intervals over a few weeks time. This method sometimes takes weeks, even months, to fulfill, but in the end it works, because every tick down lowers the cost-basis before the eventual turn. The important thing is to begin near the extremes. Crude oil is selling for less than it takes to drill, ship and deliver it almost anywhere in the world. Some OPEC countries could actually default on their debts if crude oil remains in this state of devaluation. But there is hope on the horizon. An upcoming storm of lay-offs, falling rig counts, and production cuts is beginning to slash into the North American crude suppliers (the source of oversupply), and by 2Q’2015 this pullback should be in full swing. SA author Wolf Richter fully describes this retrenchment in his fiery articles . The trade here is to gradually buy into a crude oil ETF, for example, XLE , OIL , or USO , and hold until oil hits $70/bbl. For the more speculative investor, the leveraged ETFs – UCO (2x crude), or UWTI (3x crude) are also an option.
Which Junk Bond ETF Is Best For 2015? Part 1

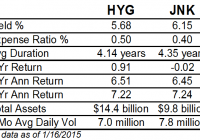
Summary JNK has a higher yield and lower expenses. HYG has higher credit quality and lower volatility. JNK and HYG have near identical returns over the past 5 years. Both have seen their payouts decline along with interest rates. The two largest high yield bond funds are the iShares iBoxx $ High Yield Corporate Bond (NYSEARCA: HYG ) and the SPDR Barclays Capital High Yield Bond ETF (NYSEARCA: JNK ). These funds use very similar strategies that result in largely similar portfolios and performance, with a few small variations. Index & Strategy HYG tracks the Markit iBoxx USD Liquid High Yield Index , while JNK tracks the Barclays High Yield Very Liquid Index. These two funds are highly correlated, to the tune of 0.9985 since 2006. Since 2010, the correlation rises to 0.9995. This comparison of some key data points reveals the main differences between the funds. Through January 16, these ETFs had near identical 3-year and 5-year annualized returns. Investors can pocket a little more income with JNK, but total returns are very similar. Along with that slightly higher yield comes a slightly higher duration, making JNK a little more sensitive to changes in interest rates. HYG has more assets and higher average dollar trading volume. The number of shares traded is very similar, but HYG’s price is more than double that of JNK. JNK is cheaper than HYG, to the tune of 0.10 percent a year. Given the similarities between the funds, the difference in cost is a big advantage for JNK. Even though HYG is at disadvantage on cost and yield, it has managed to outperform JNK. In terms of credit quality, JNK has 40 percent in BB rates bonds; 43 percent in B; and 16 percent in CCC or lower. HYG has 48 percent in BB rated bonds; 39 percent in B; and 11 percent in CCC. Performance This price ratio chart of HYG versus JNK shows the funds move in tandem, except during the financial crisis. Over the past 5 years, the two funds have fluctuated within a range of 3 percent of each other. A rising line indicates HYG is outperforming. (click to enlarge) This price ratio chart compares the price performance of HYG and JNK over the past 5 years without adjusting for dividends. It shows that HYG has benefited more from price appreciation than from income, as would be expected given HYG yields less, yet returns the same in the long-run. (click to enlarge) This chart shows their returns since 2010. (click to enlarge) Income JNK has a higher yield than HYG, but both funds have seen their payout decline amid low interest rates (data from the provider websites). (click to enlarge) The chart below shows the trailing 12-month yields based on actual payouts. JNK was paying more at the start in part because shares did under perform during the financial crisis. The main takeaway is that yields were falling due to falling interest rates (rising bond prices) and if that trend continues, investors will continue to see shrinking payouts. (click to enlarge) Risk & Reward JNK has a 3-year beta of 1.17 versus HYG’s beta of 1.09., both versus the BofAML HY Master II Index. JNK has a 3-year standard deviation of 5.33 compared to HYG’s standard deviation of 5.01. This means JNK is slightly more volatile than HYG. Both funds have exposure to the energy sector, with HYG’s provider listing its exposure at 13.82 percent. JNK does not break out its exposure by sector, but given the volatility in that sector, if it had a meaningful difference in exposure, there would be a considerable difference in returns. JNK is down 1.15 percent in the past three months versus a 0.26 percent drop in HYG. High yield bonds are less sensitive to changes in interest rates due to their lower duration, but they are very sensitive to the economy. In 2008, JNK fell 25.67 percent and HYG lost 17.37 percent. The late 2014 plunge in oil prices weighed heavily on junk bond funds. Including dividends, HYG is down about 3 percent over the past seven months, versus the 4 percent decline in JNK. The most recent turnover data from Morningstar shows JNK had turnover of 30 percent as of June 30, 2014, while HYG had turnover of 11 percent as of February 28, 2014. If HYG has historically maintained this lower turnover, this makes the cost gap smaller than the expense ratio indicates, since HYG would face fewer transaction costs. Conclusion JNK and HYG are very similar funds, but they do have their differences. JNK charges less and has a higher yield, but that comes with higher volatility and lower credit quality. HYG manages to consistently deliver nearly the same total return as JNK though. Overall, this makes HYG the more attractive ETF, especially given our position in the economic cycle. A recession isn’t brewing yet, but it has been seven years since the last one began. With better credit quality, HYG is likely to hold up better again in the next recession. Investors will receive a smaller yield from HYG, but this extra bit of income isn’t worth the risk of under performing the next time the high yield bond market suffers a major sell-off. Short-Term High Yield While HYG is a better choice than JNK in 2015, there are more funds to consider. In part 2, we’ll look at the SPDR Barclays Capital Short Term High Yield Bond ETF (NYSEARCA: SJNK ) and the PIMCO 0-5 Year High Yield Corporate Bond Index ETF (NYSEARCA: HYS ).

A Conservative Way To Invest In An Energy Rebound

Summary BCX shares have been depressed after a recent closed-end fund merger because of selling by previous shareholders of BQR. BCX is trading at a 15% discount to NAV. BCX owns stocks with strong balance sheets which will be survivors if the energy bust continues. BCX uses an option writing strategy to reduce risk. Recent increase in VIX means higher options premiums and potential increases in the distribution rate. Many investors have been looking for a good way to benefit from a “bounce” in the energy sector. There are certainly big gains in store if you buy highly leveraged small cap energy stocks and if oil and gas prices quickly recover their losses. But there is also a risk that oil prices will stagnate for quite some time which would lead to many bankruptcies or restructurings in the energy sector. A safer way to invest in an energy rebound is to buy a diversified fund that mainly holds strongly capitalized large cap energy stocks that also hedge using an option over-writing strategy. There is one closed-end fund that currently trades at a 15% discount that fits into this category. The BlackRock Resources & Commodities Strategy Trust (NYSE: BCX ) seeks high current income and current gains, with a secondary objective of capital appreciation. The fund normally invests at least 80% of its total assets in equity securities issued by commodity or natural resources companies, or derivatives linked to commodity/natural resource companies. The fund generally invests in a portfolio of equity securities and utilizes an option over-writing strategy in an effort to seek total return performance and enhance distributions. On December 8, 2014, a three way fund merger was completed where BCF and BQR were merged into BCX. I believe that one cause for the currently wide discount to NAV is that some of the old shareholders of BQR are unhappy with the merger and have been selling their shares of BCX acquired via the merger. I wrote an article on BQR (Blackrock EcoSolutions) about a year ago. The fund was marketed as investing in companies that are “environmentally friendly”. A few weeks ago, I received a message from one of my Seeking Alpha readers who said he bought BQR as a long term investment because he liked their socially conscious investments and good dividend. Shortly after the merger was completed, he looked at his brokerage account and could no longer find BQR. After some digging, he realized it was replaced by BCX. In his words- “If it wasn’t so real I would think this is a cruel joke. Eco Solutions was replaced by Big Oil”. Distributions for BCX vary over time and were reduced late last year because of drops in the underlying portfolio value. The fund currently pays a monthly distribution of $0.0771. Because of weakness in the energy sector, tax loss selling and other selling by prior BQR/BCF shareholders, this may be a good time to buy BCX for bottom fishers or contrarian investors. The discount to NAV is -15.32% which is well above the six month average discount of -13.87%. The 6 month discount Z-score is -1.47, which means that the discount to NAV is about 1.5 standard deviations below the average discount over the last six months. The one year discount Z-score is also attractive at -1.46. Because of the relatively high distribution rate of 9.72% and high discount to NAV, you get to recapture a decent amount of the discount every year. Buying BCX at the market price and receiving NAV from a distribution is equivalent to a gain of 18% on those shares. Multiply this by the distribution rate and you get a discount capture “alpha” of about 1.75% per year. This is more than the annual expense ratio of 1.25%, so adjusted for discount capture, BCX has a negative expense ratio and the fund pays you to own it. Distributions for BCX vary over time and were reduced late last year because of drops in the underlying portfolio value. The fund currently pays a monthly distribution of $0.0771. But if there is a recovery in the energy sector, we could easily see distributions increase dramatically. The recent increase in options volatility, with the VIX above 20, should also benefit funds like BCX that use an options overlay strategy and could lead to a higher distribution rate as they capture the higher option premiums. BCX is more liquid than most other closed-end funds. It trades about $4.5 million a day and usually has a bid-asked spread of only a penny. In summary, BCX is currently a good holding for a patient investor who wants to participate in the energy sector, but wants to get paid a generous distribution while waiting for a rebound. There is good chance of a rebound in the NAV along with a narrowing of the discount within the next year. Top Industry Sector Holdings (12/31/2014) Energy 33.4% Agriculture 31.2% Mining 22.8% Other 10.5% Cash + Derivatives 2.0% Top 10 Holdings (12/31/2014) Exxon Mobil (NYSE: XOM ) 5.92% Chevron (NYSE: CVX ) 5.69% Monsanto (NYSE: MON ) 4.32% Conoco Phillips (NYSE: COP ) 3.89% Royal Dutch Shell (NYSE: RDS.A ) (NYSE: RDS.B ) 3.72% Rio Tinto (NYSE: RIO ) 3.40% Weyerhauser (NYSE: WY ) 2.56% Potash Corp. of Sask. (NYSE: POT ) 2.49% CF Industries (NYSE: CF ) 2.44% Syngenta (NYSE: SYT ) 2.41% Market Cap Breakdown (12/31/2014) Large Cap (> 10 bill) 79.2% Mid Cap (2-10 bill) 13.2% Small Cap ( < 2 bill) 5.5% Cash + Derivatives 2.0% Geographic Breakdown (as of 12/31/2014) United States 67.0% Canada 10.1% United Kingdom 9.2% Switzerland 2.5% Hong Kong 2.3% Cash + Derivatives 2.0% Norway 1.7% France 1.0% Japan 0.9% Australia 0.8% Ticker: BCX BlackRock Resources & Commodities Trust Pays monthly distributions Total Net Assets= $1,112 million Total Common assets= $1,112 million Monthly Distribution: $0.0771 ($0.9252 annual) Annual Distribution (Market) Rate= 9.72% Fund Baseline Expense ratio= 1.25% Discount to NAV= -15.23% Portfolio Turnover rate= 62% Effective Leverage: None Average Daily Volume: 469,000 shares Average $ Volume: $4,500,000 % Overwritten by Options= 23.82% Type of Options= Single Stock