Tag Archives: management

What Is Driving Up SLV Besides Gold?
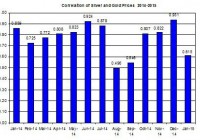
The fall in the U.S. treasuries yields keeps up the price of SLV. The rally of gold is only partly related to the recovery of silver. Despite the recovery in silver prices, SLV’s silver holdings didn’t pick up. The silver market has started off the year on a positive note as shares of iShares Silver Trust (NYSEARCA: SLV ) added nearly 14% to their value (up to date). Is most of this recovery related to the rise in gold? Let’s reexamine the relation between silver and gold and further explore other factors that drive up SLV. Despite the progress of SLV in the past few weeks, its rally seems, at first glance, less related to the rise in gold prices. The chart below shows the linear correlation of gold and silver on a month-to-month basis (daily percent changes). Source: Bloomberg In the past month the linear correlation was around 0.615; even though this is still a significant and strong correlation, it’s also well below the levels recorded in the preceding months. Moreover, the ratio between SPDR Gold Trust (NYSEARCA: GLD ) and SLV has zigzagged with an unclear trend in recent weeks, as indicated in the chart below. Source: Google finance The ratio is still at a high level of around 7.2, which means GLD has still outperformed SLV in the past year. Some investors, however, might consider the high level of the GLD-to-SLV ratio as an indication that the latter is actually cheaper than the former. I put less faith in this assessment. This ratio could keep going up or remain at this level for a long time. After all, back in the early 90s the ratio between gold and silver started off at around 70 – this is the current ratio – and kept rising up to the low 90s and remained in the 70s and 80s range up to 1997. This doesn’t negate the fact that SLV’s recovery in the past few weeks was driven, in part, by the rise in gold. It only goes to show that other factors may have come into play in pushing up silver prices. One other factor to consider is the ongoing drop in long- and mid-term U.S. treasuries yields – they may have also contributed to the rise in SLV prices. The chart below shows the progress in the 7-year U.S. treasury yield and the price of SLV in the past several months. During the period presented below, the linear correlation between the two was around -0.3 – a mid-strong correlation. Source: Bloomberg and U.S Department of the Treasury Even though the FOMC is still expected to raise its interest rates, which are likely to bring back up the U.S. treasury yields in the second half of 2015, the recent developments in the markets including low inflation – mainly due the fall in oil prices – and higher economic uncertainty drove down U.S. treasuries yields. If yields continue to come down in the short term, this could keep pushing up the price of SLV. The recent developments in Europe including the Swiss National Bank’s decision to stop pegging its currency and ECB’s upcoming announcement of its QE program also seem to drive the demand for precious metals. In terms of growth of physical metal, this seems to play a secondary role, at best, in moving the price of silver. After all, China is one of the leading silver importers. The country recently published its fourth-quarter growth rate update; it showed a 7.4% growth in annual terms. This is slightly higher than market expectations of 7.3%. But this is still lower than its growth rate of 7.7%, which was recorded in the same quarter in 2013. This year, the World Bank estimates China’s GDP will expand by only 7.1% – this is 0.4 percentage points below its previous estimate back in June 2014. The IMF also revised down the global economic growth from 3.8% to 3.5% this year. A slower growth rate for China could suggest, at face value, a slower rise in the demand for silver. Lower growth in the world economy isn’t expected to increase the industrial demand for silver but it’s likely to drive more investors towards silver. This only serves as another indication that the demand for silver on paper leads the way for the price of SLV. But is the demand actually picking up for SLV? The chart below presents the changes in SLV’s silver holdings in the past few months. Source: SLV’s website Since the beginning of the year, silver holdings have actually slightly come down by 1.4% to 325 million ounces of silver. This could be an indication that some SLV investors have taken money off the table after the price of silver rallied. Looking forward, however, the recovery of silver is likely to slowly bring more people back to SLV. The silver market has seen a recovery in recent weeks. Over the short term, silver could keep rising especially if the global economy keeps showing slower growth. For more see: 3 Reasons to Prefer Silver Wheaton

How To Design A Market Neutral Portfolio – Part 2

Summary Sector diversification is a key in market neutral investing. Two examples. Questions to solve for IRA compatibility. My previous article described the investor profile to hold a market neutral portfolio and some characteristics of this investing style illustrated by examples. I also explained why I prefer using an index ETF for the short side of the portfolio. In the next step, I want to focus on the benefit of sector diversification in market neutral investing. Sector diversification is especially important when the objective is to beat the benchmark in all market conditions, that is to say in all phases of the expansion-contraction cycle. The reality is more complicated than the figure. Cycles of different and variable periods may be in play, and macro trends can freeze the cycle for some sectors (like oil price does for energy and materials). In fact, it is sometimes quite difficult to figure out where we are and on which time frame when various cycles are combined. This is why, if an index ETF is on the short side, the long side of the portfolio must be diversified, not necessarily in all sectors, but at least in a few cyclical and defensive sectors. Since the return of such a Market Neutral Portfolio is the alpha of the long side, diversification in defensive and cyclical stocks is a key to keeping drawdowns acceptable in duration. In my opinion, the historical maximum duration in drawdown of an investing strategy is a parameter as important as the return and volatility. Examples I have performed a simulation of a portfolio mixing all the S&P 500 strategies of my book «The Lazy Fundamental Analyst» (Harriman House 2014). There are 9 strategies, one for each sector of the GICS classification, except Telecommunication (which is very small to elaborate statistical models). Each strategy selects 10 S&P 500 companies using a simple ranking process based on 2 fundamental factors. The factors are sector-dependent, chosen using historical statistics. The result is an equal-weighted portfolio of 90 stocks in a universe or 500, updated and rebalanced every 4 weeks. It is quite a big set (18% of the S&P 500 index) with various logics mixed, so the performance can hardly be suspected of being curve-fitted or random. Of course, past performance, real or simulated, is not a guarantee for future returns. But on such a portfolio it gives a good clue on the risk. The next chart shows the simulation of the 90-stock S&P 500 Lazy Portfolio (long side only) since 1999, with a 0.1% transaction cost and a 4-week rebalancing: (click to enlarge) The next table gives statistics of the excess return of the portfolio over the SPDR S&P 500 Trust ETF (NYSEARCA: SPY ) by 4-week periods, which corresponds to the market neutral portfolio with a leveraging factor 2, without the margin and carry cost for the “short half”. Average 4week return Average Annual return Max Drawdown Depth Max Drawdown Duration Avg gain / Avg loss 4week gain probability Kelly criterion Kelly crit. 95% confidence 0.94% 12.9% 20.5% 19 months 1.52 67% 0.46 0.35 Holding 90 stocks is a lot. In my real market neutral portfolio, I have reduced the number by: Excluding the most sensitive sectors to macroeconomic and geopolitical concerns: finance, energy and materials. My aim is not to get the best possible return, but a good return with a risk as low as possible. Optimizing the models to keep only 24 stocks with a diversification pattern, including at least 2 defensive sectors, 2 cyclical sectors and a minimum number of stocks in each of them. Optimizing to a lower number of stocks incurs a risk of curve fitting. However, with 24 holdings and various ranking logics, the risk remains quite low. The biggest danger of optimizing is not over-rating the possible return, but under-rating the real risk. In a diversified market neutral portfolio, the risk is limited by design. The next chart shows the simulation of my 24-stock portfolio (long side only) since 1999, with a 0.3% transaction cost and a 2-week rebalancing: (click to enlarge) This portfolio is more dynamic (rebalanced twice more often). It is also focused on large caps, but may hold a limited number of liquid small caps from the Russell 3000 index. Even if I use volume filters, I use a higher transaction cost to model a higher spread and slippage. The next table gives statistics of the excess return of the portfolio over SPY by 2-week periods, which corresponds to the market neutral portfolio leveraged twice, without the margin and carry cost. Average 2week return Average Annual return Max Drawdown Depth Max Drawdown Duration Avg gain/Avg loss 2week gain probability Kelly criterion Kelly crit. 95% confidence 0.79% 22% 11% 13 months 1.69 64.2% 0.43 0.36 These are examples. Ideas and steps can be reused with other quantitative models, or with a stock picking based on due diligence. The main idea here is to formalize and follow a sector-based diversification pattern. A next article will explain how to use leveraged ETFs to implement this strategy with a lower or no leverage (ProShares Ultra S&P 500 ETF (NYSEARCA: SSO ), ProShares UltraPro S&P 500 ETF (NYSEARCA: UPRO )), and the consequences of using inverse ETFs to avoid short selling (ProShares Short S&P 500 ETF (NYSEARCA: SH ), ProShares UltraShort S&P 500 ETF (NYSEARCA: SDS ), ProShares UltraPro Short S&P 500 ETF (NYSEARCA: SPXU )). Indeed market neutral investing can be implemented in an IRA account. Feel free to follow me if you don’t want to miss it. Data and charts: Portfolio123 Additional disclosure: Long SPXU as a hedge. Past performance is not a guarantee of future returns.

Am I Crazy Enough To Short Volatility Here?

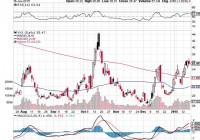
Recent volatility in stocks has presented yet another opportunity to profit. The VXX has moved up sharply after I went long and as a result, I sold my position. I’m now back to being short the VXX on a bet that the markets will calm down this week. Early last week I wrote a piece about how I had gotten short volatility and then reversed quickly after realizing the market was moving against me. That proved to be a fortunate thing to do as I missed the big move up in volatility (in the good way) by not being short. As I detailed in the linked article, I chose to get long right as I sold out of my short position via the short VXX ETF (NASDAQ: XIV ) and moved into a long position in the VIX ETF (NYSEARCA: VXX ) while hedging with covered calls. In this way, I wanted to capture huge premiums that were available on VXX call options and also take advantage of what looked like a coming move up in volatility. As it turns out, that was the way volatility moved last week and the VXX closed up huge on the week. I was fortunate enough to capture most of that move but by hedging with short calls, I did give up some potential upside. Still, being long the VXX for four trading days and hedging with calls netted me a 6% total gain in four days; not bad work if you can get it. The flip from short to long volatility certainly worked out in my favor and given the gains that I achieved in such a short time span, I carefully considered my next move for this week. In doing so, I considered where the VXX had come from and how far it had moved since having a big downturn. This is a one year chart of the VXX and what it shows, as most of us know, is that VXX tends to spike when it does go up and then fall precipitously seemingly without warning. (click to enlarge) I started shorting VXX back in October during the mini-crash that roiled stock markets and since that time, have had pretty good results getting long and short volatility at different times. The most recent spike that has driven VXX up to as high as $37 seems to be running out of steam, in this humble trader’s opinion. And therefore, I’ve decided once more get short volatility via the XIV, the ETF that provides the inverse, unleveraged return of the VXX. For reference, I sold out of the VXX at $36.63 and bought the XIV at $26.45 a few moments later. If you like, of course, you can just short VXX but that’s expensive and difficult to do so just buying XIV is much cleaner. At any rate, the decision was made to get short volatility because I feel like the fear and panic was wavering at the end of the week. Several days of markets being beaten over the head with terrible news and heavy selling tends to exhaust traders and in a world where the central banks of our nations can move markets higher simply by talking, I feel like recent history provides decent precedence from which we can derive the duration and severity of up moves in the VXX. Of course, nothing is perfect and I could be dead wrong about this move being done but in order to make some money, you’ve got to take calculated risks. For that reason, I think getting long XIV here makes lots of sense. There is no doubt that the VXX clearing its previous high from December means we’ve got a situation on our hands. There are plenty of reasons for volatility right now but what I’m betting on is that there will be at least a small reprieve from the panic. Panic, by definition, can only last for so long so a trade into XIV is a bet that the panic is ending and that normalcy will return, at least for a few days. Keep in mind that you don’t need to be right for a long time to make money on this trade; I’m essentially renting XIV until some calm returns to markets again and then it’s back out of the short volatility position. As always, please understand that trading volatility, particularly from the short side, can be quite hazardous. If some shock occurs VXX will spike and XIV will crater, leaving you with massive losses. Please understand how the ETF works and what you’re risking before taking a position. The plan right now is to stay in XIV until one of two things happens; either normalcy returns to markets and XIV moves up very nicely or I’m dead wrong and I get crushed and limp away with my losses. Either way, I think we’ll know this week which one it is and at that point, I’ll reassess which side I want to play on the volatility front. In my first volatility article of 2015 I mentioned I’d keep you abreast of my thoughts and any moves I ended up making and I’m trying my best to do that; please remain engaged in the comments sections because we’re all learning together and sharing thoughts and ideas and I love it. Good luck out there.