Tag Archives: management

Lumber Is The Canary In The Homebuilders’ Coal Mine
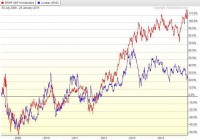
Summary Lumber prices have historically tracked quite well with homebuilder stocks. Homebuilders have also recently surged past the S&P in recent months. With the deceleration in price gains still going on and Fed support quickly evaporating, there is nothing left to prop up this industry. While I have been generally skeptical of the supposed recovery in homebuilder stocks, I have limited my analysis to trends in home prices and the ability of the American consumer to handle a mortgage at current prices. For me, this analysis is sufficient to show that homebuilder stocks are in a pretty large bubble. In the following article, though, I plan to show the value of homebuilder stocks relative to lumber prices, which themselves are a good economic indicator, but also tend to follow the valuation of homebuilder stock. The Tight Relationship of Lumber and Homebuilders (click to enlarge) In the preceding chart, I have plotted the SPDR S&P Homebuilders ETF (NYSEARCA: XHB ) and spot lumber prices. A clear correlation emerges from before 2009 to around 2013. What we also see is that around 2013, while lumber prices crashed, homebuilder stocks continued onward, and more recently have even seen some gains. Generally lumber prices are thought to track the economy quite well. While many economic analysts have been bullish on the future of the US economy, commodity and bond markets have been showing for more than a year now signs of languish. A plot of corporate bond prices would show much the same thing as lumber prices in this graph, as they also have stalled starting around the beginning of 2014. More interestingly, other commodities have started to follow along in this weakening trend, with oil recently showing a spectacular fall and copper following along. Commodity markets are showing signs of warning about the future of the economy. Lumber especially has shown a historical tight relationship with the value of homebuilder stocks, and given what has happened over the past two years, we ought to be worried about the future prospects for share prices. The next plot that I have shown is the past 6 months of the relationship between lumber and XHB. (click to enlarge) What we see from this chart of the relative valuation of XHB to lumber prices is that they have traded in a relatively tight range. Starting in 2015, however, we notice a sharp spike upwards that was quickly corrected. Over the past few days this relative valuation has shot up again. Given the last swift correction in this ratio, we can probably expect homebuilders to go down in the near-term. The homebuilder rally seems to be losing steam, as the market reacted violently to this push above historical highs. Future Prospects for Timber (click to enlarge) In order to predict future movements in the price of wood, shown above is a graph of the iShares S&P Global Timber & Forestry Index Fund (NASDAQ: WOOD ). Chaikin Money Flow analysis shows strong price growth ending around the middle of September, interrupted by a strong selloff in October, corresponding quite nicely with the overall stock market. Interesting is that since then there was a brief rise in money flow, but even while this has slowed noticeably, the price appreciation has still continued. This seems like price gain without much support, and so even timber prices themselves may be unsustainable in the medium term. What is more worrying for timber prices is the state of the overall economy. Consistently low oil will likely result in slowed economic activity as oil exploration companies drastically reduce capex spending. With decreased capital spending, we can assume downward pressure on GDP growth, which is an ominous sign for timber, as well as for housing. Technical Analysis of XHB (click to enlarge) Technical analysis of XHB itself shows signs of weakness. At the end of November XHB reached a value of about 33.50, at which point momentum was lost and the stock began to fall. While XHB has been higher since then, it also has not been able to make any real progress. Volatility in XHB has drastically increased since that time, and perhaps a greater source of worry is the Chaikin Money Flow, which turned definitely negative throughout December and has not been solidly positive since then. The market seems to find the current valuation as high enough. Summary and Action to Take XHB has seen to lost momentum, as it has not been able to have a solid increase in value since the end of November. In addition, the trend of homebuilders with XHB is approaching historic highs, and this has been met with swift correction in XHB. The long term trend shows definite signs of worry, as lumber has not agreed with the high current valuation of XHB. Now would be a great time to sell any shares of XHB, as the stock is not likely to go any higher from here on. For a more speculative investment, shorting XHB would likely be a good idea. A long time horizon is probably needed for that trade to play out, though, as XHB has been able to keep this high relative valuation for more than a year now, and only time will tell how long it will be able to keep this up. In addition, if you want to play on the underlying weakness of the US economy, shorting the WOOD ETF may be the way to go. If GDP is unable to sustain itself, then timber prices will go down along with it. This is a very speculative move, however, since timber itself does not show signs of being overbought like the homebuilders. Still, timber is going to hurt if the economy slows. I still take shorting homebuilders as the safer option since not only will they fall if the economy stumbles, but they are also presently overvalued and due for a correction even if GDP does not change much. Disclosure: The author is short XHB. (More…) The author wrote this article themselves, and it expresses their own opinions. The author is not receiving compensation for it (other than from Seeking Alpha). The author has no business relationship with any company whose stock is mentioned in this article.
Updating The Baker’s Dozen Portfolio: A Slight Modification Of The IVY 10

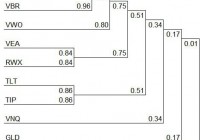
Constructing a portfolio with as few as 13 ETFs. Reduce risk by introducing a “circuit breaker” ETF. Finding low correlated ETFs. A slight modification to the IVY 10 Portfolio. The Baker’s Dozen Portfolio was first presented approximately three months ago. This is an update of that momentum model which is a slight modification of the IVY 10 Portfolio. While the Baker’s Dozen includes 12 ETFs plus SHY , the cutoff ETF, it could easily be paired down to 10 as VOE and VBR are highly correlated with VTI . As with the IVY 10 Portfolio, it does not take many ETFs to provide global diversification. In this portfolio VEA is selected as the Developed International Equity instead of VEU since VEU also contains emerging market stocks. The asset class, Emerging Markets is covered by using VWO . This removes a little duplication that shows up in the IVY Portfolio. PCY is part of the Baker’s Dozen in an effort to spread the risk from domestic to international securities. Gold (NYSEARCA: GLD ) is included in the Baker’s. Otherwise the holdings compared to the IVY 10 are similar. The following thirteen ETFs were selected for their diversity and low correlations. Vanguard Total Stock Market ETF VTI – This ETF covers the entire U.S. Equities market and therefore should be part of any portfolio that uses ETFs for core investments. Vanguard Mid-Cap Value ETF VOE – As a mid-cap value ETF, this security is highly correlated with VTI, but is included to provide a value tilt to the portfolio as recommended in the Fama-French five factor model (FF-5). Vanguard Small-Cap Value ETF VBR – In keeping with the FF-5, this ETF is added even though it too is highly correlated with VTI. If one were to simplify this portfolio, VOE and VBR are the two ETFs to eliminate from the Baker’s Dozen. Vanguard FTSE Developed Markets ETF VEA – For our developed international equities ETF we select VEA. Vanguard FTSE Emerging Markets ETF VWO – VWO is our emerging market ETF of choice. If one wishes to further simplify the portfolio it is possible to merge VEA and VWO and use only VEU as that ETF includes emerging market stocks. Vanguard REIT ETF (NYSEARCA: VNQ ) – Domestic Real Estate is included as an inflation hedge and it provides a good source of income. SPDR Dow Jones International RelEst ETF (NYSEARCA: RWX ) – International Real Estate provides an additional hedge to inflation and it adds another asset class with good income. PowerShares Emerging Markets Sov Dbt ETF PCY – Emerging markets sovereign debt is a different type of security and is added for both diversification and high yield. PowerShares DB Commodity Tracking ETF (NYSEARCA: DBC ) – Commodities is another asset class and serves as a low correlation asset when compared with VTI. SPDR Gold Shares GLD – Precious metals is yet another asset class that has a low correlation with our equity holdings such as VTI, VOE, and VBR. iShares 20+ Year Treasury Bond (NYSEARCA: TLT ) – This 20+ Treasury instrument provides backing from the U.S. Government and adds additional diversity to the portfolio. iShares TIPS Bond (NYSEARCA: TIP ) – TIPs are included as another inflation hedge. This ETF also has a low correlation with equity securities. iShares 1-3 Year Treasury Bond SHY – This Treasury ETF is our cutoff or “circuit breaker” security as this management model seeks ETFs that are performing above SHY and sells ETFs that are under-performing SHY. These ETFs were selected for low correlations as shown in the cluster diagram below. As mentioned above, VOE and VBR are highly correlated with VTI and are the first places to simplify this portfolio. ETF Rankings: The following ranking table contains many risk reducing clues. The primary one is to stay away from ETFs that are ranked below SHY. Currently, that includes Commodities and Gold . A secondary risk reducer is to sell the security when it is price below its 195-Day Exponential Moving Average. VEA and DBC would be sold on that basis. Back-testing indicates better returns are obtained when one concentrates the portfolio in a few ETFs rather than spreading out investments over a larger number of holdings, even if they are performing above SHY. For a number of weeks, VNQ and TLT have been the stars of the Baker’s Dozen. (click to enlarge) Performance Graph: The following performance graph is a recent example of how a portfolio made up of just a few well-diversified ETFs performed since early October of 2014. This graph is from the Rutherford Portfolio and readers can click on the link to learn more about the management of this portfolio. Portfolios are reviewed every 33 days and in the case of the Rutherford, rebalancing moved equal percentages of the portfolio into the top two holdings. If this were to be rebalanced today, we would hold 700 shares in VNQ and 450 shares in TLT in this $125,000 portfolio. These figures are rounded. (click to enlarge) Disclaimer: The above graph will not likely continue this wide divergence from the VTTVX benchmark. 1) The time period is very short for this “live” portfolio. 2) I do not expect TLT to continue its excellent performance. Over the last month there were days when TLT was running in the opposite direction of the market and this aided the overall performance of the Rutherford. It is expected that these momentum managed portfolios will outperform the market when the next severe bear market strikes. That will be the real test of this risk reducing model. Disclosure: The author is long VNQ, TLT, VTI, RWX. (More…) The author wrote this article themselves, and it expresses their own opinions. The author is not receiving compensation for it (other than from Seeking Alpha). The author has no business relationship with any company whose stock is mentioned in this article.

Brookfield Infrastructure Offers Investors A 5% Dividend Yield And 13% Discount To Intrinsic Value

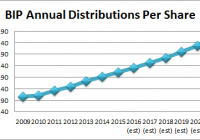
Summary BIP recently increased its dividend by 10% and now sports a 5% dividend yield. We believe BIP’s long-term dividend growth rate is 9%, up from 7% in our previous report. BIP’s shares are still 13% below its fair intrinsic value and we expect its intrinsic value to steadily increase as BIP steadily grows its FFOs per share. BIP’s disciplined approach to investing and its ability to continually identify new investment opportunities. We expect 15% FFO/share growth in 2015 and at least 6.5% growth thereafter. Brookfield Infrastructure Partners (NYSE: BIP ) recently announced it increased its dividend distribution by 10%. Although it was lower than our previous single year dividend growth in 2015, it was higher than our previous 7% estimated long-term dividend growth rate. BIP’s dividend increased by 13% annually since its 2008 IPO and BIP expects its long-run dividend growth rate will be 5%-9%. We believe that future dividend growth will be closer to the higher end of its forecasted range as it offers strong, steadily growing cash flow funds from its operations, which enables BIP to provide investors with strong dividend yields and dividend growth. BIP offers investors a 5% dividend yield and we believe its share price is 13% undervalued relative to its fair intrinsic value. For these reasons, we reiterate investors accumulate shares in BIP, especially income-oriented investors as BIP continues its consistent performance . Source: BIP’s Investor Relations and Our Estimates Companywide Highlights: BIP’s Q4 2014 FFOs/unit was $.86, slightly missing analyst expectations for the fourth time in the last 5 quarters but increasing by 3.6% versus Q4 2013. Key drivers of this performance were as follows Incremental contributions from the mid-August close of its investment in Vale’s cargo transportation division VLI, Improved volumes at its UK ports and Australian railroads, Soft volume demand from its North American energy transmission businesses due to mild weather and The absence of incremental contributions from its former Australasian regulated distribution operations, which BIP sold last November. Source: BIP’s Q4 2014 Report Business Segment Highlights: BIP Transport saw a 20% increase in its FFO’s for 2014 versus 2013 primarily driven by contributions from the additional investment in BIP’s Brazilian toll road in Q3 2013 as well as increased volume from its ports division and a partial quarter’s contribution from its investment in Vale’s cargo transportation VLI. Not only is this a high-quality asset, but Vale provided BIP with a minimum return mechanism to ensure that a minimum return is achieved over a period of up to six years from closing. As the Brazilian economy is facing some negative headwinds , this minimizes the risk of BIP failing to generate a positive return from its investment in VLI. Highlights from BIP Transport’s business units were as follows: BIP Transport’s Ports business enjoyed 21.4% FFO growth due to improved volumes from its UK port operations and incremental contribution from its newly acquired North American container port acquired during the year. BIP Transport’s Railroad business’s FFOs increased by $14M year-over-year (7.5%) because of a partial year’s incremental contribution from its Q3 2014 investment in Vale’s cargo transportation division as well as increased harvest grain volumes from its Australian railroad operations. BIP Transport’s Toll Road business saw its FFOs increase because of additional investment in its Brazilian toll roads completed in Q3 2013. On a “same-store basis”, toll revenues increased by 8% year-over-year due to tariff increases and higher volumes on Chilean roads. Source: BIP’s 2009-14 Annual Reports BIP Utilities saw a 2.65% decrease in its 2014 FFOs versus 2013 on a reported basis but increased 12% on an adjusted comparable continuing operations basis. The decrease in reported FFOs was primarily attributable to the sale of its Australasian regulated distribution operations on November 30, 2013. Excluding the impact of the sale, the segment’s FFOs increased by $39M versus the prior year as of the result of improved performance at BIP’s UK regulated distribution business. Source: BIP’s Financial Reports, Supplemental Reports BIP Utilities’ maintenance capital expenditures in 2014 were $14M and were $27M less than YTD 2013. BIP Utilities’ Regulated Terminal grew by 2.2% as negative movements in foreign exchange offset incremental pro forma operating income growth due to additions to its rate base. BIP Utilities’ Electricity Transmission business increased its FFOs by 7.4% due to inflation indexation, commissioning of projects into rate base and lower operating costs, partially offset by impact of foreign exchange. BIP Utilities’ Regulated Distribution’s adjusted FFOs from continuing operations grew by 22.5% as its United Kingdom regulated distribution operations benefited from a higher rate base, inflation indexation, lower costs and higher customer connections revenue. Source: BIP’s 2009-14 Annual Reports BIP Energy’s FFOs decreased by $2M year-over-year as incremental contribution from the acquisitions district energy businesses during the last 12 months was not enough to offset lower transportation volumes at its Energy Transmission, Distribution & Storage Business. BIP North American gas transmission business continues to see headwinds from the weak natural gas market, which resulted in a $275M asset impairment charge in 2013. Although BIP Energy’s performance has been flat since 2011, at least its capital expenditure backlog more than doubled during the year, which signals potential future growth. Other sources of potential future growth for BIP Energy include the closing of three previously announced acquisitions including gas storage businesses in California and Texas and a district energy system in Seattle. BIP also acquired a district energy business in Australia recently and is closing the acquisition of another one as well. Source: BIP’s 2011-14 Annual Reports BIP’s Corporate and Administrative segment’s FFO decreased by $12M (13%) in the year as increased interest and distribution income and reduced financing costs were offset by the absence of BIP Timber’s results as BIP sold BIP Timber in H1 2013 and higher management fees paid to Brookfield Asset Management. Corporate highlights include the following: BIP’s previously announced acquisition of a 23% interest in the French communications tower infrastructure firm TDF is expected to close in March 2015. BIP Corporate refinanced $4B of its debt in 2014 in order to capitalize on the historically low interest rate environment. BIP’s weighted average cost of debt is 5.9% and the average maturity profile is over 10 years, with minimal maturities over the next 5 years. BIP identified $1B in non-core assets that it seeks to sell in order to redeploy towards areas of growth and core operations, on top of its $1B capital-recycling program in 2013. BIP finished the year with $2.1B worth of total liquidity through its cash and available credit facilities. BIP has a BBB+ credit rating and it expects strong demand for its future offering $300M-$500M corporate debentures, which it seeks to bring to market in H1 2015. BIP’s opportunities for investment Government Privatizations-In Australian alone, BIP identified $50B worth of potential privatizations by the federal and state governments there Brazilian Construction Companies-BIP recognizes that many Brazilian construction companies are facing financial challenges and may seek to part with high-quality infrastructure related assets in order to shore up liquidity. Corporate deleveraging and carve-outs-BIP had success in acquiring utility assets from capital constrained European companies and is now Maturing Infrastructure Funds- Many investment funds raised between 2005 and 2008 are approaching the expiry of their funds. BIP has started to see the first wave of divestitures from this ownership group. Lastly, BIP focuses on investing capital to meet its long-term return targets of 12%-15% and will not reduce its return thresholds to make it easier to acquire assets Conclusion: In conclusion, investors looking for high yields and non-equity correlation should consider accumulating a position in BIP due to its portfolio of unique, hard-to-replicate assets. BIP provided unit-holders with strong returns from capital appreciation and partnership unit distributions since it went public in 2008. BIP offers a 5% dividend yield and its unit price is within 13% of its fair intrinsic value. We expect BIP’s FFOs to increase by at least 6.5% annually over the next seven years and its dividend distributions to increase by at least 9%. We can see why over 50% of BIP’s shares are held by leading asset managers such as Brookfield Asset Management, Legg Mason, BAMCO, Principal Global Investors and Scotia Bank’s asset management divisions. For these reasons, we believe investors should realize that BIP is a great alternative to the S&P 500 and traditional utilities as represented by the XLU and take advantage of market weaknesses to strategically accumulate units of BIP. Source: FactSet Marquee and our Estimates Disclosure: The author has no positions in any stocks mentioned, and no plans to initiate any positions within the next 72 hours. (More…) The author wrote this article themselves, and it expresses their own opinions. The author is not receiving compensation for it (other than from Seeking Alpha). The author has no business relationship with any company whose stock is mentioned in this article.