Scalper1 News
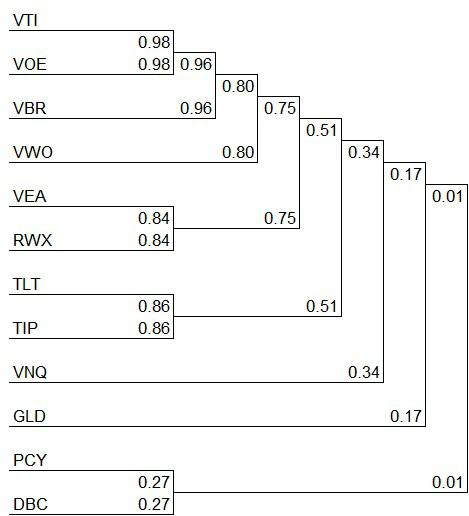
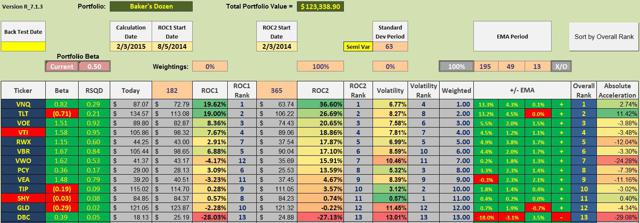
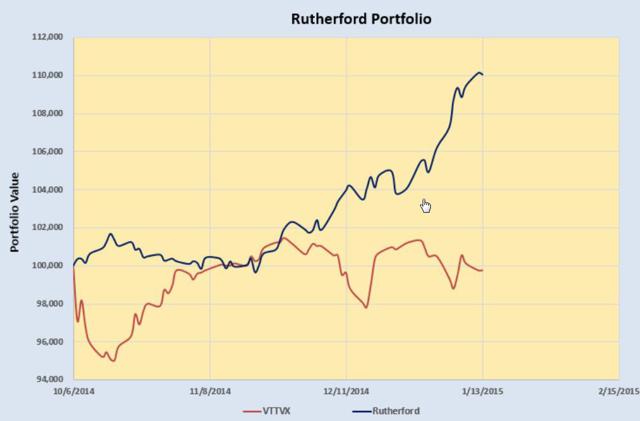 Constructing a portfolio with as few as 13 ETFs. Reduce risk by introducing a “circuit breaker” ETF. Finding low correlated ETFs. A slight modification to the IVY 10 Portfolio. The Baker’s Dozen Portfolio was first presented approximately three months ago. This is an update of that momentum model which is a slight modification of the IVY 10 Portfolio. While the Baker’s Dozen includes 12 ETFs plus SHY , the cutoff ETF, it could easily be paired down to 10 as VOE and VBR are highly correlated with VTI . As with the IVY 10 Portfolio, it does not take many ETFs to provide global diversification. In this portfolio VEA is selected as the Developed International Equity instead of VEU since VEU also contains emerging market stocks. The asset class, Emerging Markets is covered by using VWO . This removes a little duplication that shows up in the IVY Portfolio. PCY is part of the Baker’s Dozen in an effort to spread the risk from domestic to international securities. Gold (NYSEARCA: GLD ) is included in the Baker’s. Otherwise the holdings compared to the IVY 10 are similar. The following thirteen ETFs were selected for their diversity and low correlations. Vanguard Total Stock Market ETF VTI – This ETF covers the entire U.S. Equities market and therefore should be part of any portfolio that uses ETFs for core investments. Vanguard Mid-Cap Value ETF VOE – As a mid-cap value ETF, this security is highly correlated with VTI, but is included to provide a value tilt to the portfolio as recommended in the Fama-French five factor model (FF-5). Vanguard Small-Cap Value ETF VBR – In keeping with the FF-5, this ETF is added even though it too is highly correlated with VTI. If one were to simplify this portfolio, VOE and VBR are the two ETFs to eliminate from the Baker’s Dozen. Vanguard FTSE Developed Markets ETF VEA – For our developed international equities ETF we select VEA. Vanguard FTSE Emerging Markets ETF VWO – VWO is our emerging market ETF of choice. If one wishes to further simplify the portfolio it is possible to merge VEA and VWO and use only VEU as that ETF includes emerging market stocks. Vanguard REIT ETF (NYSEARCA: VNQ ) – Domestic Real Estate is included as an inflation hedge and it provides a good source of income. SPDR Dow Jones International RelEst ETF (NYSEARCA: RWX ) – International Real Estate provides an additional hedge to inflation and it adds another asset class with good income. PowerShares Emerging Markets Sov Dbt ETF PCY – Emerging markets sovereign debt is a different type of security and is added for both diversification and high yield. PowerShares DB Commodity Tracking ETF (NYSEARCA: DBC ) – Commodities is another asset class and serves as a low correlation asset when compared with VTI. SPDR Gold Shares GLD – Precious metals is yet another asset class that has a low correlation with our equity holdings such as VTI, VOE, and VBR. iShares 20+ Year Treasury Bond (NYSEARCA: TLT ) – This 20+ Treasury instrument provides backing from the U.S. Government and adds additional diversity to the portfolio. iShares TIPS Bond (NYSEARCA: TIP ) – TIPs are included as another inflation hedge. This ETF also has a low correlation with equity securities. iShares 1-3 Year Treasury Bond SHY – This Treasury ETF is our cutoff or “circuit breaker” security as this management model seeks ETFs that are performing above SHY and sells ETFs that are under-performing SHY. These ETFs were selected for low correlations as shown in the cluster diagram below. As mentioned above, VOE and VBR are highly correlated with VTI and are the first places to simplify this portfolio. ETF Rankings: The following ranking table contains many risk reducing clues. The primary one is to stay away from ETFs that are ranked below SHY. Currently, that includes Commodities and Gold . A secondary risk reducer is to sell the security when it is price below its 195-Day Exponential Moving Average. VEA and DBC would be sold on that basis. Back-testing indicates better returns are obtained when one concentrates the portfolio in a few ETFs rather than spreading out investments over a larger number of holdings, even if they are performing above SHY. For a number of weeks, VNQ and TLT have been the stars of the Baker’s Dozen. (click to enlarge) Performance Graph: The following performance graph is a recent example of how a portfolio made up of just a few well-diversified ETFs performed since early October of 2014. This graph is from the Rutherford Portfolio and readers can click on the link to learn more about the management of this portfolio. Portfolios are reviewed every 33 days and in the case of the Rutherford, rebalancing moved equal percentages of the portfolio into the top two holdings. If this were to be rebalanced today, we would hold 700 shares in VNQ and 450 shares in TLT in this $125,000 portfolio. These figures are rounded. (click to enlarge) Disclaimer: The above graph will not likely continue this wide divergence from the VTTVX benchmark. 1) The time period is very short for this “live” portfolio. 2) I do not expect TLT to continue its excellent performance. Over the last month there were days when TLT was running in the opposite direction of the market and this aided the overall performance of the Rutherford. It is expected that these momentum managed portfolios will outperform the market when the next severe bear market strikes. That will be the real test of this risk reducing model. Disclosure: The author is long VNQ, TLT, VTI, RWX. (More…) The author wrote this article themselves, and it expresses their own opinions. The author is not receiving compensation for it (other than from Seeking Alpha). The author has no business relationship with any company whose stock is mentioned in this article. Scalper1 News
Scalper1 News