Tag Archives: management

OIL – Buy It Here Post EIA Release

Summary I have noticed a trend in oil trading around the EIA Petroleum Status Report release. The data showing an ongoing build in inventory to record high crude oil levels reassures energy bears and resets energy prices lower this time each of the last two weeks. Longer term investors are looking forward to an eventual end of oil inventory build, and are setting a floor for oil prices. I would use this weakness to buy into the iPath S&P GSCI Crude Oil ETN and other relative investments for the long-term. Over the last two weeks I have noted a trend in oil prices that can be exploited by investors and traders alike. Oil prices have slipped each of the last two weeks heading into the EIA’s Petroleum Status Report, on fear that the inventory data might show large inventory builds. However, once the report is released, despite it’s showing of inventory build, oil prices have found some support likely from long-term investors looking to forward developments. As a result, there’s an opportunity for entry in the iPath S&P GSCI Crude Oil ETN (NYSE: OIL ) here. 1-Month Chart of the OIL at Seeking Alpha The one-month chart of the iPath S&P GSCI Crude Oil ETN shows a recent double-dip. For each of the last two weeks, oil prices and the shares of the OIL ETN have dipped ahead of and into the EIA Petroleum Status Report . The reason for concern is a greater than expected build in oil inventory, which strengthens the glut argument and forces oil prices lower. This week’s data followed trend. The EIA Report Just like last week, this week’s data for the period ending February 6 showed another build in oil inventory. The EIA Report shows that crude oil refinery inputs averaged 15.6 million barrels per day, which was 20K more than the prior week. Crude oil inventory increased by 4.9 million barrels through the week. Importantly, at 417.9 million barrels, crude oil inventory stands now at its highest point in at least 80 years and likely its highest level in history. This news again reinforced the argument about an oil glut, and it gives reason for lower oil prices and lower distillate prices, like gasoline. Thus, once again, fear of this news and the realization of this news drove a dip in the price of oil. Just after the report was released, WTI Crude futures were down 2.5% and Brent Crude was down 3.0%. The iPath S&P GSCI Crude Oil ETN was off 2.8%, but had come up off its lows. The United States Oil ETF (NYSE: USO ) was down 2.5%. Last week, oil prices moved higher off the lows set around the data release and they appear to want to do the same this week. Already crude oil futures have hemmed in their losses. Why is that? It’s because energy experts see this crude oil build ending eventually, at which point inventory can begin to see draws instead of builds, and the level of inventory can come off its high. It will eventually happen, because the rig count is coming off as we flirt with the level of oil prices where drilling is no longer profitable for the average driller. The least efficient of drillers are being squeezed out of the market as well, and so supply should come off. Even the largest of energy sector players are now reducing workforce (see my report on Halliburton ). So as producers of oil cut back, the flow of crude into inventory must come off to meet demand levels. This makes a long-term argument for the purchase of energy sector issues, especially those tracking the commodity here like the OIL ETF. The oil stocks have already enjoyed a significant burst higher, but they are now dealing with news of layoffs and earnings estimate reductions, and eventually disappointing earnings results. The OIL ETF gives investors a vehicle now to avoid all that noise and still benefit from the long-term recovery of oil prices on continuing global growth and a lesser supply environment to meet demand. In conclusion, I think you can use this bad news event as an opportunity for best entry to buy the OIL ETF security and other relative investment securities for the long-term. I am following energy closely now and so my column might prove valuable to relative interests. Disclosure: The author has no positions in any stocks mentioned, but may initiate a long position in OIL over the next 72 hours. (More…) The author wrote this article themselves, and it expresses their own opinions. The author is not receiving compensation for it (other than from Seeking Alpha). The author has no business relationship with any company whose stock is mentioned in this article.
IHD: A Tough Sell Based On Performance

Summary IHD invests in emerging markets, which has been a tough market of late. That said, it offers investors a large yield. The problem is the yield is eating away at the CEF’s NAV. The Voya Emerging Markets High Dividend Equity Fund (NYSE: IHD ) is an interesting closed-end fund, or CEF, for those seeking an emerging market play. Essentially, it allows you to add a high-yield investment ( around 11% ) in emerging markets, a key asset allocation basket, to your portfolio. That’s not easy to find. For example, The Vanguard Emerging Markets Stock Index Fund (MUTF: VEIEX ) is yielding around 2.65% based on trailing distributions. But, IHD’s income comes at a cost you may not be willing to pay. What it does IHD’s objective is total return from a mixture of dividends, capital gains, and capital appreciation. It invests, as its name suggests, in emerging market equities. Typically, the portfolio will hold between 60 and 120 securities. On top of that, IHD will sell options on as much as 50% of the portfolio’s value. The options can be on individual stocks but also on indexes and exchange traded funds. Presumably that’s to increase the opportunities for option writing since options on some holdings may not exist or be liquid enough to trade. When looking for stocks, IHD starts with filters based on dividend yield and liquidity to create a universe from which to select individual holdings. It then takes the top-ranked stocks from this list and does fundamental research, evaluating such things as dividend sustainability and growth potential. At the end of the day, IHD is looking to create a portfolio of attractively valued companies with sustainable dividend yields and the potential for growth. The fund’s expenses aren’t outlandish at around 1.4%, according to the Closed-End Fund Association. The fund is, after all, providing active management in areas of the world that are often difficult to invest in, let alone find information about. You probably couldn’t do what they do, even if you wanted to. And that’s before trying to sell options. What about performance So far so good, but… the fund’s performance is middling at best. According to Morningstar, IHD’s trailing three-year annualized net asset value, or NAV, return through January of -1.3% falls at about the 65th percentile of its diversified emerging markets category grouping. Note that Morningstar’s figures include the reinvestment of dividends. The broader category effectively broke even over that span and Vanguard Emerging Market Index Fund posted an annualized gain of roughly 0.75%. So, IHD’s performance is a little below par, but a fat 11% yield might entice you to overlook this fact. That would likely be a mistake here. When IHD came public in early 2011, its NAV was $19.06 a share. The CEF’s NAV fell consistently through February of last year (its fiscal years end in February), bringing the NAV down to $12.50 a share. Sure it paid distributions of around $4 a share over that time, but the NAV decline was precipitous. The NAV is currently around $11.50 a share, which means it’s still going down. You’ll need a rally To be fair, emerging markets haven’t been the most hospitable place to invest in recent years. But this is clearly a case where the large dividend is doing a disservice to shareholders. That’s particularly true if you are using those distributions to live off of. Worse, you’d still be losing money even if you reinvested those distributions. I could go into the fund’s discount (roughly 8%, notably below the fund’s three-year average of about 3%), its country allocations (China is its largest weighting at 20% of assets), sector allocations (finance is around 30% of the portfolio), and individual holdings, but at this point all of that pales in comparison to the distribution’s impact on NAV. Even the chance of the discount closing isn’t particularly enticing in my book compared to the NAV issue. I would avoid IHD unless you think emerging markets are on the verge of a major bull market. That’s the only way you’ll likely see the NAV turn higher. Disclosure: The author has no positions in any stocks mentioned, and no plans to initiate any positions within the next 72 hours. (More…) The author wrote this article themselves, and it expresses their own opinions. The author is not receiving compensation for it (other than from Seeking Alpha). The author has no business relationship with any company whose stock is mentioned in this article.

Electric Transmission In Transition – Sheltering $1 Billion A Year In Potential Future ROE

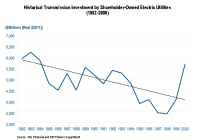
With an average FERC base-rate ROE of 10%, electric transmission firms could earn $1 billion a year in allowed returns from investments made 2014-2017. Last fall, the IRS ruled transmission firms could quality as a REIT structure. REIT structures could entice large utility firms to spin-off their transmission business. The electric transmission business may be starting to tiptoe into a vast sea of change. With the exception of ITC Holdings (NYSE: ITC ), the majority of transmission assets are held within much larger diversified electric utilities. For example, American Electric Power (NYSE: AEP ) owns the largest transmission network in the US with about 32,000 miles of line. First Energy (NYSE: FE ) is not far behind with 24,000 miles. Other major utilities with substantial transmission assets are: Southern Company (NYSE: SO ), Duke Energy (NYSE: DUK ), PG&E (NYSE: PCG ) and Edison International (NYSE: EIX ). Pacific Corp is building 4,300 miles of new lines and Xcel (NYSE: XEL ) has 3,300 miles of projects on the books. AEP is building 27 projects consisting of 3,200 miles of lines in partnership with others. Combined, AEP’s projects total $9 billion. The partnership of Duke and American Transmission is not far behind with 2,700 miles of additions. American Transmission is a joint venture of several utilities and municipalities in Wisconsin. Even the Oracle of Omaha is collaborating with AEP in a 50-50 partnership to build transmission projects in Texas. It is common knowledge that the grid has suffered from years of neglect and is demonstrated by the graph outlining transmission investments from 1982 to 2000. After hitting bottom at under $3.5 billion, annual investments are stabilizing over the next three years at $20 billion a year. The following graph outlines industry wide investments from 2008 to projected 2017. Source: eei.com (click to enlarge) Source eei.com About 45% of cap ex is dedicated to expansion of the network, and an additional 15% goes for replacement due to age, obsolescence, and storm damage. Between 2014 and 2017, there are expected to be 22,800 additional miles of transmission lines in the US. The balance of investments is grid network improvements such as fundamental, advanced technologies, and enhanced security. Projected Transmission Capital Expenditures by Type of Activity Years 2014 to 2017 Source eei.com Transmission investments industry-wide are expected to total $78 billion between 2014 and 2017. If 50% if this investment is considered equity and the FERC-allowed average ROE is 10%, the total industry-wide allowed return could translate to an additional $1 billion a year from investments made from 2014 to 2017. Historically, FERC regulated assets are more profitable than state regulated assets. For example, prior to FERC’s recent ruling in New England, ITC could earn between 12% and 13% return on equity vs. the most recent state average allowed return of just under 10%. Below is a chart from eei.com (pdf) outlining the average state regulated rates going back to 1990. The chart is from their quarterly report “Rate Case Summary” Source eei.com The FERC is under pressure to reevaluate its rate structure in some regions in the country. For example in the Northeast, the FERC settled a complaint by reducing the allowed return on transmission assets. Consumer advocates are pushing the New England rate structure as a nationwide model. In a press release , last year, the FERC announced a new maximum allowed base ROE of 10.57% for assets in the New England region, and was a reduction from the previous rate. In addition, there are several incentive clauses that could increase the base rate, such as a 0.5% incentive for stand-alone, independent companies. Currently ITC is the only publicly traded utility that qualifies for this incentive. More information on ITC can be found in a SA review from last May here and more information on the transmission business from the Edison Electric Institute here . But that may soon change. The dawn of utility asset financial engineering is upon us. The spin offs of natural gas pipelines and mid-stream assets into limited partnerships, along with the recent separation of NRG’s generation into NRG Yield (NYSE: NYLD ), foretells of structural changes within the transmission sector. Last fall, the IRS ruled that entities such as electric transmission assets could quality for a REIT structure. From a Moody’s article last Oct: Large US power transmission utilities are actively exploring the feasibility of using the real estate investment trust structure as a financing vehicle, says Moody’s Investors Service. It is plausible that utility REITs might emerge as early as late next year (2015). “Many US utilities are taking a look at their transmission assets to assess whether utilizing a REIT structure makes sense, given the abundance of these types of assets that produce steady cash flows,” says Moody’s Associate Managing Director Jim Hempstead in the report “US Utility Transmission Assets: Power Transmission REITs Poised to be Sector’s Next Phase of Financial Engineering.” Utilities have been pursuing “financial engineering” structures because yield-hungry investors assign premium valuations to vehicles with steady dividend growth trajectories, says Moody’s. From an article on publicpower.org explaining the IRS ruling and reporting on Moody’s report: In 2014, the Internal Revenue Service clarified existing rules that define what constitutes real estate. As a result, the REIT sector has grown as companies look to spin off their assets into new companies that are effectively exempted from corporate taxes as long as they operate within REIT guidelines. The 2014 IRS clarifications have helped open the REIT structure to non-traditional sectors, such as electric transmission in the case of utility companies; or fiber optic and copper networks, in the case of telecommunications companies. Potential REIT candidates in the utility sector include Texas-based transmission and distribution utilities and large transmission-only companies. Transmission assets make for an alluring REIT because they provide steady income that allows for dividends, a key feature for REIT investors. Utilities that create REITs out of their transmission assets are separating a yield asset from their growth assets, Moody’s said. “Regulatory contentiousness risk might increase because customer groups will object to future rate requests more aggressively,” the report said. “Other regulatory considerations that are likely to become more active include discussions over the appropriate cost of capital, the authorized return on equity and cost allocations.” Moody’s still sees ITC’s FERC-regulated transmission assets as a candidate for becoming a REIT. It also sees American Electric Power Co. Inc., FirstEnergy Corp., Xcel Energy Inc. and Entergy Corp., all companies that Moody’s said make transmission a core strategy, as likely candidates. Electric utility investors should be aware that a change in corporate structure also brings with it a potential credit downgrade as a higher portion of operating cash flow moves on to shareholders. Much like the REIT conversion craze that started in the timber industry in the last 1980s and leading to culmination of most timber companies now structured as REITs, the attraction of financial engineering transmission assets could be too tempting to avoid. All it will take is one to lead the way. ITC would be the most logical choice as it is already an independent firm. I expect larger utilities will then be under greater pressure to spin off their transmission businesses also as REITs. However, the impact of distributing greater portions of operating cash flow to shareholders to satisfy the REIT regulations, rather than reinvesting it as equity in additional growth projects, needs to be evaluated. Moody’s believes this will become a prominent topic of utility conversation by the end of this year. If they are correct, a new REIT sector will be born, offering the advantages of high shareholder distributions supported by federally regulated assets, which are more profitably than similar state-regulated investments. Author’s Note: Please review disclosure in Author’s profile. Disclosure: The author is long ITC, SO, AEP. (More…) The author wrote this article themselves, and it expresses their own opinions. The author is not receiving compensation for it (other than from Seeking Alpha). The author has no business relationship with any company whose stock is mentioned in this article.