Tag Archives: loader

Contango Is Working Against U.S. Oil ETF Investors

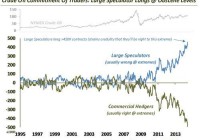
Summary WTI crude oil is in a state of contango, which will cost USO shareholders roughly 17 cents per share this month. The net long position for speculators is still too high. A V-shaped recovery in oil is unlikely. By Ivan Y. WTI and Brent crude oil prices finished 2014 down 46% and 48%, respectively. Besides a surplus in oil, which is expected to be more than 1 million bpd in 2015 for OPEC oil based on current production levels, a rising U.S. Dollar, and negative momentum, there are two other factors that are currently working against investors in The United States Oil ETF, LP (NYSEARCA: USO ). Back to Contango Just a few months ago, WTI oil was in a slight backwardization. This provided a slight benefit to USO shareholders due to the fact that the fund was paying a cheaper price when it rolled over its crude contracts every month. However, WTI oil is currently in a state of contango. Although it is not a big spread, the fund will have to pay a premium when it does its monthly rollovers. Based on Friday’s closing price, the March 2015 contract is 45 cents more expensive than the February 2015 contract. That represents a 0.85% premium and is equivalent to about 17 cents in the share price of USO. If the spread does not change this month, investors should expect USO to deteriorate in value by about 17 cents per share this month. This may not affect short-term traders, but anyone who plans to hold USO for a longer period can consider selling out-of-the-money covered call options to make up for the expected loss. For example, currently, the January (5th week) $23 call is priced at 18 cents on the bid. Selling that call should be sufficient to compensate for the expected contango loss. USO would have to rise by over 15% in order for that call to be in-the-money, so it’s likely to expire worthless. The COT Report Another issue that could put a damper on USO is the fact that speculators, according to the most recent COT report for positions as of December 23, 2014, still have a very high net long position. The so-called speculators (e.g. hedge funds) are not considered to be the smart money in the commodity markets. The report shows that they are net long by 320,337 contracts. That is significantly less than the peak of roughly 450k contracts during last June, but it is still high when compared historically. Prior to 2011, which you can see in the chart below, the net long position had not exceeded 250k contracts, and even 100k during that period was considered to be extremely high. The fact that speculators still have a very high net long position, at least when compared historically, means that there probably needs to be more liquidation before we arrive at a more normalized net long position. Thoughts on Price In hindsight, I was clearly wrong about where the price of oil would bottom. Back in October, I suggested that Brent oil would bottom around $85 (which would’ve been roughly $80 for WTI) because that was Saudi Arabia’s fiscal breakeven point. I completely underestimated the political and competitive risks to that assumption. First, at least in my opinion, one of the primary reasons for oil’s collapse was due to an orchestrated attempt by the U.S. (via Saudi Arabia’s refusal to defend the price) to punish Vladamir Putin for his extra-curricular activities in Ukraine. This is an obvious strategy that works due to the Russian government’s reliance on oil & gas sales for revenue. Second, it is also obvious that Saudi Arabia also wants to curtail the shale oil revolution in the U.S. It seems like every week, some person associated with OPEC will say something that indicates that they will not cut production and will let market forces dictate the price, even if it drops to $20 according to a Saudi oil minister. How many times do they need to keep repeating the same message? That being said, oil has already been pushed down enough to curtail cap-ex spending by many producers. Here are a few examples: Penn West (NYSE: PWE ) cuts 2015 cap-ex by $215 million ConocoPhillips (NYSE: COP ) cuts 2015 cap-ex by 20% Marathon Oil (NYSE: MRO ) cuts 2015 cap-ex by 20% However, low prices probably need to persists for several months at least in order for exploration and production to be cut in the longer-term. It really looks like Saudi Arabia is willing to suffer in the short-term in order to benefit in the long-term. Based on that, a V-shaped rebound in oil is unlikely. Saudi Arabia could, if they wanted to, move the price back up immediately just by making an announcement that they will cut production, but it doesn’t look like they want to do that. I think USO is going to struggle for several more weeks or months.
A Market Needing To Resolve Divergences In 2015

As 2014 has come to a close, investors have turned their attention to 2015 and looking for clues as to what the market and economy have in store for the new year. Below are divergences that unfolded in 2014 which raises the question of how they will be resolved this year. The resolution of these divergences will likely have implications on the performance of an investor portfolios this year. Oil Prices Knowing the stock market is not the economy and vice versa , determining factors contributing to the significant decline in oil prices is important. Certainly, increased supply is influencing the decline in crude prices. Equally though, as we have noted in several earlier articles, we believe lack of demand is also a contributing factor. The importance of the reduced demand leads strategists to raise the question of whether the global economy is entering a slowdown. To date, the U.S. seems to have shaken off the potentially negative impact of slowing economies outside its borders. Given the interconnectedness of the economic world today though, can the U.S. continue on its growth path while many other economies in the developed and emerging world struggle with growth? As the below chart indicates, historically, falling oil prices have been associated with slowing global GDP. Aubrey Basdeo, Managing Director at Blackrock, noted the potential negative impact of an extended run of low oil prices in an article late last year titled, Free Fallin’ . The article’s conclusion, Wherever the price ends up, it’s likely it’ll stay there for a while. We don’t see demand increasing, especially with China cooling off. In the short-term that could be good news for our economy – lower gas prices mean people have more money to spend – but it remains to be seen just how our country will be impacted by a sub-$60 oil price. The longer it stays low, though, the more difficult things could get. Highlighted in the Felder reference below was a comment by Howard Marks’ in a recent investor letter , “It’s historically unprecedented for the energy sector to witness this type of market downturn while the rest of the economy is operating normally. Like in 2002, we could see a scenario where the effects of this sector dislocation spread wider in a general ‘contagion.'” High Yield Bonds: Reduced Investor Risk Appetite The performance of high yield bonds has an above average positive correlation to the performance of equities. In short, as the economy grows, companies tend to experience better earnings growth. This improved earnings outlook generally leads to improved equity returns. Broadly, as companies generate better earnings growth, highly leveraged ones tend to experience an improved outlook as well. This in turn reduces the risk of default with highly leveraged companies. Consequently, high yield bond prices are bid up as investors are attracted to the higher yields provided by high yield debt in an environment where default risk seems lessened. A recent article by Jesse Felder of The Felder Report took an in depth look at the long term and short term price movements of high yield (NYSEARCA: HYG ) relative to a riskless 3-7 year Treasury ETF (NYSEARCA: IEI ) and the S&P 500 Index . As the first chart below shows, the high yield relative to treasury bond investment tracks closely with the S&P 500 Index. Felder notes in his article, Clearly, the chart above demonstrates that the strength in junk risk appetites led stocks off the lows back in 2009. Over the past summer, however, junk bonds started to lag stocks for the first time since the bull began (or lead lower, depending on your perspective). Since then the divergence has only gotten wider with each subsequent new high in the stock market [as seen in the below chart]: Large Caps Versus Small Caps And The Dollar The one asset allocation decision investors and advisers needed to get right in 2014 was to overweight U.S. equities, large caps more specifically, versus broad international. As can be seen in the two charts below, U.S. large cap stocks had a decisive performance edge versus developed international (NYSEARCA: EFA ), emerging markets (NYSEARCA: EEM ) and small cap equities (NYSEARCA: IWM ). With economies currently weaker outside the U.S. and interest rates lower in many European countries, foreign investors have allocated investment dollars to the U.S. This flow of funds into the U.S. has contributed to downward pressure on U.S. interest rates as well as continued upward pressure on the U.S. Dollar. The top chart above shows a longer view of the trade weighted US Dollar and its recent strength, although strong shorter term, the strength does not look exhausted when viewing the longer term chart. The implication of a stronger dollar has to do with the potential earnings headwind for large multinational companies. In a slow growing economy, the currency headwind can take a bite out of corporate profit growth. If this occurs, small and mid size companies are less exposed to exchange rates as business for these companies is mostly generated domestically. Lastly, the U.S. equity markets opened higher on the first trading day of the new year, but quickly turned lower near the time the ISM Manufacturing Index was reported. The manufacturing index was reported at 55.5 which was below consensus expectations of 57.5. This was the slowest rate of monthly growth in six months. Econoday noted, “growth in new orders slowed substantially, to 57.3 from November’s exceptionally strong 66.0, while backlog accumulation also slowed, to 52.5 from 55.0. Production slowed to 58.8 vs. 64.4….The abundant run of manufacturing reports point to year-end slowing in a sector which is oscillating going into the New Year.” The above highlights are just a few divergent factors that have developed recently. From a positive perspective, the equity markets have a tendency to climb the proverbial ” wall of worry .” We will cover more of our thoughts on these topics in our upcoming year end Investor Letter.

Energy Funds Worst Performers In 2014 As Oil Price Crash

Energy mutual funds finished the year as the biggest loser after registering a 16.7% year-to-date loss. The other losers were Natural Resources, Equity Precious Metals and Miscellaneous Sector, which slumped 12.5%, 10% and 0.2%, respectively. For the energy sector, the slump was unavoidable given the nosedive that crude prices suffered in the second half of the year. Currently, oil is deeply entrenched into bearish territory and has fallen below the $60-a-barrel level following OPEC’s decision to hold production unchanged, the effects of booming shale supplies in North America and a stagnant European economy. Moreover, a stronger dollar has made the greenback-priced commodity more expensive for investors holding foreign currency. The cut in global crude demand growth by major energy consultative bodies has put the final nail in the coffin. The concerns have dealt severe blow to the energy sector, and as evident from the fact that energy mutual funds category was the biggest loser in 2014. Let’s look at the funds that were the biggest losers last year, and with unfavorable Zacks Mutual Fund Rank they continue to be funds that should be dropped from investors’ portfolios. The 2014 Crude Selloff The West Texas Intermediate (WTI) crude price lost momentum in June and has since then been showing weakness. This is primarily owing to plentiful North American shale supplies in the face of lackluster demand expectations, sluggish growth in China and the prevailing softness in the European economy. Strengthening of the U.S. dollar also impacted the demand for the greenback-priced crude as it is now expensive for importers to buy oil. Amid the soft oil pricing scenario, the international cartel of oil producers’ – Organization of the Petroleum Exporting Countries (OPEC) – stand against oil output cut on Thanksgiving Day added to the supply concern. We believe that the decision reflects the strategic move by Saudi Arabia − which holds the top spot in terms of total production among the 12 OPEC members − to get an advantage over U.S. shale producers. This is because shale oil, which has been witnessing large-scale production in the U.S over the last few years, is relatively expensive. Hence, in the environment of tumbling oil price, it will be difficult for U.S. shale producers to garner sufficient earnings to stay afloat in the industry. OPEC also cut its 2015 forecast consumption by 280,000 barrels per day from its previous expectation, walking in the same track as U.S. Energy Information Administration (EIA) which trimmed its demand outlook for next year by 240,000 barrels per day. Moreover, U.S investment bank Morgan Stanley has given a weak crude pricing projection as it does not expect prices to recover next year. All these acted as dampeners, which dragged down the oil price nearly 50% since mid June. WTI crude is now trading at $57.33 per barrel, a five-year low. In our view, crude prices in the next few months are likely to exhibit a sideways-to-bearish trend, mostly trading in the $55-$65 per barrel range. As North American supply remains strong and demand looks underwhelming, we are likely to experience further pressure in the price of a barrel of oil. 3 Worst Performing Energy Funds The following energy funds were the worst performers in 2014 based on year-to-date loss they suffered. These funds should be dropped from portfolio, as they carry unfavorable Zacks Mutual Fund Rank #4 (Sell) or Zacks Mutual Fund Rank #5 (Strong Sell) as we expect the funds to underperform its peers in the future. Remember, the goal of the Zacks Mutual Fund Rank is to guide investors to identify potential winners and losers. Unlike most of the fund-rating systems, the Zacks Mutual Fund Rank is not just focused on past performance, but the likely future success of the fund. These funds also have high expense ratios. Rydex Energy Services C (MUTF: RYVCX ) seeks growth of capital. The fund invests a majority of its assets in equities of small to mid-cap Energy Services Companies that are domestically traded. It also invests in derivatives. The fund may also buy American Depositary Receipts for exposure to non-Us energy companies. RYVCX currently holds a Zacks Mutual Fund Rank #4 (Sell) and has lost 29.4% year to date. It has lost 39.2% over the last six months. The fund carries an expense ratio of 2.37% as compared to category average of 1.53%. BlackRock Energy & Resources Investor B (MUTF: SSGPX ) invests a lion’s share of its assets in equities of global energy and natural resources companies. It also invests in companies belonging to utilities sector. The fund mostly focuses on small-cap firms. The non-diversified company invests without limit across the globe and usually in at least three countries. SSGPX currently holds a Zacks Mutual Fund Rank #4 (Sell) and has lost 26.2% year to date. It has lost 37.1% over the last six months. The fund carries an expense ratio of 2.1% as compared to category average of 1.53%. RS Global Natural Resources C (MUTF: RGNCX ) seeks growth of capital over the long term. The fund invests most of its assets in companies considered by the fund’s investment team to be primarily involved in natural resources industries. The fund invests in companies from a minimum of three countries. RGNCX currently holds a Zacks Mutual Fund Rank #5 (Strong Sell) and has lost 23.5% year to date. It has lost 36.5% over the last six months. The fund carries an expense ratio of 2.21% as compared to category average of 1.47%.