Tag Archives: load

UNG Is Down For December — Will Cold Weather Pull It Back Up?
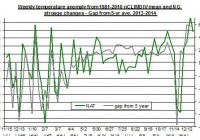
Summary The extraction from storage is projected to be lower than normal again this week. The temperatures are projected to come down in the next two weeks, but this isn’t expected to bring back up UNG. Contango is likely to keep UNG below natural gas prices. The price of The United States Natural Gas ETF (NYSEARCA: UNG ) took another fall in the past week to its lowest level in recent months. The ETF did bounce back earlier this week, but is still down for the month by nearly 24%. The ongoing low oil prices may have contributed to weakness of UNG, but the main issue will remain in changes in weather expectations . The level of underground storage is also likely to play a role in the progress of UNG. This was the case last week. This week’s extraction is likely to also be lower than normal for the season. As I pointed out in the past , the changes in the weather are likely to play a significant role in the changes in U.S. storage levels. Last week’s lower-than-expected withdrawal may have contributed to the drop in UNG on the day of the publication. I say this with caution because the linear correlation between the changes in UNG and storage tends to be low. Nonetheless, there are occasions when the market seems to react to this news, as seems to be the case last week. Looking forward, the storage is expected to show another lower than normal extraction due to last week’s higher than normal average temperature, as presented in the chart below. Source of data: EIA and national climate data center The chart shows the progress of the deviation in the national weather from normal and the weekly changes in natural gas storage with respect to the 5 year average (The data only refer to 2012/2013 and 2014 winter time). Moreover, the linear correlation between the two data sets is a strong and positive linear correlation of 0.62. Last week, the deviation from normal temperatures was, on average, 4.9. So all things being equal, we are likely to see another lower than normal extraction. Keep in mind that even if natural gas prices were to recover, the ongoing Contango in the future markets is likely to result in UNG underperforming natural gas for the near term. Cold weather ahead For the next two weeks, however, temperatures are projected to fall below average temperature throughout the Northeast and Midwest. Nonetheless, on a national level, the heating degrees for this week are expected to be slightly below normal and last year’s levels. This could suggest the demand for heating purposes in the residential/commercial sectors, while may rise in the coming days, won’t necessarily increase more than normal for this time of the year. The recent withdrawal from storage was 49 Bcf, which was well below the 5-year average and last year’s extraction of 138 Bcf and 177 Bcf, respectively. The table below summarizes the changes in storage in the past few weeks and the comparison to last year and the 5-year average levels. Source of data EIA Following the recent extraction the underground natural gas storage is at 3,246 Bcf. This is nearly 5% higher than last year’s storage level and only 5% below the 5-year average. Over the next couple of weeks we are likely to see another lower than normal extraction from storage, which could fuel another fall in the price of UNG or at the very least keep it from recovering. But if temperatures start coming down to below normal levels, UNG may change course and start to rally.


The Case For Maintaining A Strategic Allocation To Real Assets

As investors continue to look for ways to diversify their portfolios away from traditional long-only stock and bond investments, real assets have become a popular alternative asset class. In fact institutional investors, such as leading endowments and foundations, have long used investments in real assets such as real estate, commodities, timber and energy as both a hedge against inflation and as a core diversifier. To provide more insight into this asset class and how institutional investors are using real assets, Michael Underhill, chief investment officer of Capital Innovations and a leading manager of multi-asset real return portfolios, answers a few questions for us on the topic. Given the increase in regional conflicts and greater overall geopolitical risks today, how is this influencing your respective portfolio positioning from both a macro and micro perspective? As geopolitical risks rise we would expect higher volatility in markets, increased risk of supply shocks to key commodities such as oil and food and a discounting of potential higher inflation and subsequent higher interest rates. As a hedge to these types of macro risks, exposure to real assets, and their relative inflation hedge qualities would become more attractive. Positioning on a more micro level we are incorporating these geopolitical risks and have been reducing our relative portfolio weighting in more interest rate sensitive groups such as electric utilities and telecomm and increasing more inflation hedge real assets such as energy, timber, agricultural commodities. What are the risks that investors should think about hedging or mitigating today and why? A common mistake investors make is to extrapolate current environment out too far and become complacent. The current environment of low interest rates, low inflation, and low volatility has afforded the opportunity to hedge the risk that this environment changes over the investment horizon. Do you want to bet that this backdrop we have had since the financial crisis does not change? The ideal time to add real asset exposure is when not many are thinking about it – buy an umbrella when the sun is shining. If we examine an allocation to real assets over the past 24 years, as shown in the chart below, we can see improved portfolio efficiency, with enhanced returns and lower volatility. Historical Effect of Allocating to Commodities (January 1980- July 2014) What are the opportunities investors should be seeking exposure to and why? In 2015, we expect improved global growth and a mid-year increase in US interest rates. The ECB and the BOJ remain in easing mode, and the policy outlook in the rest of the world varies considerably. The risk that global growth remains sluggish is high, and a lack of meaningful improvement could lead to a sharp increase in the dollar and a significant reorientation of capital flows. Most regions should see decreasing growth headwinds in 2015, although geopolitical uncertainties, volatile oil prices, and moderating Chinese growth remain concerns. It is for these reasons that we continue to advocate for a diversified, tactically managed, multi-asset portfolio that seeks to generate returns in excess of the actual rate of inflation and provides managed volatility rather than a single-asset-class solution. A broad range of real asset equity securities, including emerging markets and commodities, real estate investment trusts, and directly held positions in master limited partnerships. How does a global multi-asset real return strategy fit into a liability driven investing framework? The tangible properties of a real asset allow its price to fluctuate with overall market prices of physical assets. Real assets tend to be sensitive to inflation because of their tangible nature. Examples of real assets include direct investment in real estate, commodities, precious metals, timber, energy, farmland, precious metals, commodity-linked stocks, and commodity-linked hedge funds. Most investors are more familiar with investments in financial assets, which are contractual claims that do not generally have physical worth. In an LDI platform, real assets provide potential reductions in surplus volatility to the extent that real asset movements are not highly correlated to movements of financial assets. Returns from real assets may also boost returns since real assets are generally not as efficiently priced as the more competitively priced stocks and bonds. The return potential for real assets has become especially attractive in recent years since stocks and bonds have not performed well. From a risk management perspective, a key benefit from expanding asset classes to include real assets rests on correlations. A group of assets that have high correlations with each other but have low correlations with other groups of assets represent an asset class. There tends to be much less diversification potential from combining assets within an asset class than from combining assets from different asset classes. Real assets represent such a broad asset class that a wide range of correlations exist both within the asset class and with assets from other asset classes, allowing for attractive diversification. Our clients have found that the best performance comes from avoiding the large losses that markets often impose on passive investment portfolios. This tends to be especially important for real assets. As a first step we look behind the market consensus and identify where herding and overreaction phenomena may be at work. These phenomena occur both within and across asset classes. We perform extensive modeling with sensitivity analysis to find our best risk management strategy for an LDI structure. From there we model our best set of segments within an asset class and simulate the surplus volatility and return. This is not just simple quantitative analysis because we must also build in forward looking scenario planning. We track actual LDI performance against expected LDI performance. This type of tracking is revealing in that we can review what we were expecting when the allocations were set and identify where things developed differently. This type of learning over many years of experience is very helpful in building analysis skills.

Should You Look For Value In Cash Flows?

Most deep-value investors look at the balance sheet and P/E multiples when they are hunting for bargains, a strategy taught by the godfather of value investing, Benjamin Graham . However, what strategies like these fail to take into account is cash flow. Glen Greenberg and Donald Yacktman are two respected value investors, both of whom invest not just with asset value in mind but also cash flows. This strategy has yielded results. Greenberg’s fund, Chieftain Capital Management achieved a compounded annual growth rate of 25% from 1984 through 2000, the S&P 500 achieved a return over 16% over the same period. Annual returns through 2010 were 18%. Greenberg uses a DCF model to make his investments but rather than the traditional DCF method, in the style of Graham, Greenberg looks for a margin of safety before investing. This margin of safety is a hurdle/discount rate of 20% for all potential investments when computing the DCF. The rate was lowered to 15% in order to reflect the interest rate environment. (click to enlarge) Adjusted cash flows Meanwhile, Yacktman uses an adjusted cash flow figure to value securities. Yacktman equates the forward rate of return with a company’s free-cash yield . He calculates this yield by computing the FCF, then adds in the cash he believes the business can generate through growth and adjusts for the effect of inflation. That figure is then divided by the stock price. Using this adjusted cash flow figure, Yacktman compares the stock’s forward rate of return with yields on long-term Treasuries. The wider the spread, the deeper the discount and the more attractive the stock is to Yacktman. DCF valuations for forecasting free cash flows: Not clear cut The use of a DCF valuation places less reliance on current market valuations. Instead, it emphasizes the full-information forecasting of free cash flows over a multi-period finite horizon. In comparison, PE models are dependent upon the fact that current earnings measures are good proxies for value, placing emphasis on current, not future value. Moreover, DCF calculations allow for the choice of an appropriate finite horizon, estimation of growth beyond the horizon, and in its standard implementation, estimation of an appropriate WACC and of the value of non-equity claims on the firm. In other words, the valuation is more comprehensive and provides a long-term valuation of the company that it not dependent upon wider market valuations. That being said, there is some evidence to suggest that price targets calculated using a P/E multiple, are more accurate that price targets computed using a DCF analysis. A study entitled “ Does valuation model choice affect target price accuracy? ” found that DCF models are used to justify higher price targets by optimistic analysts. Additionally, a study entitled, Valuation Accuracy and Infinity Horizon Forecast: Empirical Evidence from Europe , published within the Journal of International Financial Management and Accounting 20:2 2009, found that when calculating a DCF forecast, analysis’ tend to factor in an “ideal” long-term growth rate, which is just above the WACC: …Therefore, using this ‘‘ideal’’ growth rate leads to the determination of ‘‘ideal’’ Target Corporation (NYSE: TGT ) prices that respect the long-term steady-state assumptions… Therefore, it’s easy to conclude that if a DCF figure is used to calculate a price target, or identify value opportunities , a suitable, conservative set of figures should be used to compute the DCF in order to prevent optimistic forecasting. Disclosure : None.