Tag Archives: load

My First Look At SCHM And It Falls Just A Little Short
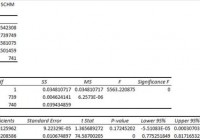
Summary I’m taking a look at SCHM as a candidate for inclusion in my ETF portfolio. SCHM looks just a tad too risky for its high correlation. The ETF has great diversification in its investments, but the value still fluctuates slightly too much. If the risk was slightly lower, I would want to carve out a small space for it. I’m not assessing any tax impacts. Investors should check their own situation for tax exposure. Investors should be seeking to improve their risk adjusted returns. I’m a big fan of using ETFs to achieve the risk adjusted returns relative to the portfolios that a normal investor can generate for themselves after trading costs. I’m working on building a new portfolio and I’m going to be analyzing several of the ETFs that I am considering for my personal portfolio. One of the funds that I’m considering is the Schwab U.S. Mid-Cap ETF (NYSEARCA: SCHM ). I’ll be performing a substantial portion of my analysis along the lines of modern portfolio theory, so my goal is to find ways to minimize costs while achieving diversification to reduce my risk level. What does SCHM do? SCHM attempts to track the total return of the Dow Jones U.S. Mid-Cap Total Stock Market Index. At least 90% of funds are invested in companies that are part of the index. SCHM falls under the category of “Mid-Cap Blend”. Does SCHM provide diversification benefits to a portfolio? Each investor may hold a different portfolio, but I use (NYSEARCA: SPY ) as the basis for my analysis. I believe SPY, or another large cap U.S. fund with similar properties, represents the reasonable first step for many investors designing an ETF portfolio. Therefore, I start my diversification analysis by seeing how it works with SPY. For investors curious about my personal choices, I will probably use (NYSEARCA: SCHX ) in place of SPY. I stick to using SPY in these articles because it is better known. I start with an ANOVA table: (click to enlarge) The correlation is about 94%. Diversification with SPY (or an alternative) will still provide some benefits. At 94%, the diversification benefits won’t be huge but I would still consider SCHM as an addition to a portfolio rather than replacing SPY as a core holding. Standard deviation of daily returns (dividend adjusted, measured since January 2012) The standard deviation is higher. For SCHM it is .8614%. For SPY, it is 0.7300% over the same period. SPY usually beats other ETFs in this regard. Because the correlation is fairly high and the volatility is higher, it will be more difficult for me to find a way to use SCHM for risk adjusted returns. Mixing it with SPY At a 50/50 weighting, the standard deviation of the portfolio is .7837%. Even with 95% in SPY and 5% in SCHM, the standard deviation of the portfolio is .7341%. The strong correlation makes it very difficult to get a level of diversification that is high enough to really offset the additional risk. Why I use standard deviation of daily returns I don’t believe historical returns have predictive power for future returns, but I do believe historical values for standard deviations of returns relative to other ETFs have some predictive power on future risks and correlations. Under standard deviation of daily returns, the S&P 500 is remarkably efficient in long term growth relative to volatility. Yield & Taxes The distribution yield is 1.41%. The SEC yield is 1.33%. Based on the yields, I think the ETF isn’t a great pick for investors nearing retirement and they should consider leaning towards higher yield “value” funds. For a retiree, a position in SPY (or SCHX) still makes sense, but I just don’t see a good way to use SCHM unless it is a very small position. In my opinion, most readers aren’t interested in the case for putting one half of one percent into an ETF. It just wouldn’t be worth the hassle for individual retirees. I’m not a CPA or CFP, so I’m not assessing any tax impacts. Expense Ratio The ETF is posting .07% for an expense ratio. I want diversification, I want stability, and I don’t want to pay for them. That is cheaper than SPY, but more expensive than SCHB. All around, 07% is still a very solid ratio. Market to NAV The ETF is at a .02% premium to NAV currently. In my opinion, that’s not worth worrying about. It is practically trading right on top of NAV. However, premiums or discounts to NAV can change very quickly so investors should check prior to putting in an order. Largest Holdings The portfolio has spectacular diversification. Having less than .60% in any single stock is the kind of diversification I’m willing to pay the higher expense ratio for, but I think this sector of the market is offering a compelling level of risk adjusted returns on an aggregate basis. (click to enlarge) Conclusion I’m currently screening a large volume of ETFs for my own portfolio. The portfolio I’m building is through Schwab, so I’m able to trade SCHM with no commissions. I have a strong preference for researching ETFs that are free to trade in my account, so most of my research will be on ETFs that fall under the “ETF OneSource” program. SCHM doesn’t look like a bad ETF. It isn’t a terrible investment by any means, but I don’t think it will fit in the portfolio I’m building. I’m still defining risk as the deviation of returns, and so long as the historical deviation is fairly accurate, I don’t think I can allocate enough of my portfolio to SCHM to make it worth having the additional position. Even without monetary trading costs or taxes to consider. When my portfolio gets so large that one percent is meaningful, I may reconsider using a small exposure to SCHM. If the correlation was only 83 to 80% or if the standard deviation of daily returns was in the .79% to .81% range I’d be much more likely to consider a 5% allocation to SCHM. If I saw the ETF trading at a .3% to .4% discount to NAV, I’d consider that fairly attractive, but I don’t expect such a discount to exist during open trading hours. Additional disclosure: Information in this article represents the opinion of the analyst. All statements are represented as opinions, rather than facts, and should not be construed as advice to buy or sell a security. Ratings of “outperform” and “underperform” reflect the analyst’s estimation of a divergence between the market value for a security and the price that would be appropriate given the potential for risks and returns relative to other securities. The analyst does not know your particular objectives for returns or constraints upon investing. All investors are encouraged to do their own research before making any investment decision. Information is regularly obtained from Yahoo Finance, Google Finance, and SEC Database. If Yahoo, Google, or the SEC database contained faulty or old information it could be incorporated into my analysis. The analyst holds a diversified portfolio including mutual funds or index funds which may include a small long exposure to the stock.

Best ETF Strategies For 2015

Stocks are on their way to close this year on a strong note–with the S&P 500 index up 15% year to date-the third consecutive year of double-digit growth for the index. With the economy growing at the fastest clip in more than a decade, stocks are expected to continue their upward move, as companies will be able to boost their profits. Plunging energy prices and low interest rates will further benefit stocks. At the same time, after a bull run of almost six years, stocks are not cheap. And with the Fed expected to start raising rates sometime next year, many wonder how long the stock market party can go on. As we head into 2015, it may be a good time to look at the investment landscape and reposition your investment portfolio for the new year. Can the Bull Run Continue in 2015? U.S. stocks are still more attractive compared to most other asset classes and investors should continue to favor them in coming months as well. The Fed has gone out of its way in assuring investors that it will be “patient” in raising rates. Some may argue that rising rates will kill the stock market rally, but history tells us that the initial phase of rate increase is almost always accompanied by higher stock prices. And the reasons are clear-the increase in rates reflects an improving economy and lower risk of deflation-which are positive for stocks. Thus, stocks are the place to be in next year. Top Sectors for 2015 My favorite sectors for 2015 are Technology, Retail and Financial. Many U.S. corporates have accumulated huge piles of cash on their balance sheets and as the economy gathers steam, they should be more inclined to increase spending on R&D and Capex, benefiting tech firms. Low oil prices and slowly rising wages are good for U.S. consumers. Strong holiday sales suggest that consumer spending will grow as plunging oil prices increase disposable incomes. Financials have come a long way since the great recession with much healthier balance sheets and improved risk management systems in place. With improving economy, the sector has been able to grow earnings and increase dividend payouts. The Vanguard Technology ETF (NYSEARCA: VGT ), SPDR Retail ETF (NYSEARCA: XRT ) and SPDR Financials ETF (NYSEARCA: XLF ) are worth considering. Many energy stocks and ETFs look enticingly cheap now but I think it would be better to wait till we see some signs of oil prices bottoming out, unless you can stomach high volatility in anticipation of gains over much longer period. What to Expect from the Bond Market? Robust economic growth in the U.S. in the face of soft economic conditions in many other parts of the world, coupled with accommodative monetary policy worked great for bonds. In fact, the unexpected rally in the Treasury bond market this year surprised most. Treasury bonds-in particular longer term– may continue to benefit from heavy buying by foreign investors, as long as interest rates remain ultra-low in Europe and Japan, the U.S. dollar continues to strengthen and long term inflation expectations remain benign. Shorter term yields however may rise in anticipation of fed funds rate hike and thus the trend of yield curve flattening may continue next year. Municipal bonds were also big winners this year as investors poured $23.9 billion into municipal debt funds due to their tax benefits and relatively “safe” status. With flat supply expected in 2015 , municipal bonds may continue to outperform. Emerging Markets-Winners and Losers? With the plunge in oil prices, emerging markets landscape has undergone a significant change. Countries like China and India are among the biggest beneficiaries of cheap oil. China is the second largest importer of oil in the world and each $1 decline in oil price saves the country $2.1 billion annually. India relies on imports for 75% of its energy needs and oil accounts for about a third of its imports. Further, the government spends a lot on fuel subsidies. Declining oil prices will not only help the country narrow down its trade and budget deficit but also bring down inflation. With easing inflation, the central bank will be able to lower interest rates, boosting economic growth. Take a look at WisdomTree India Earnings ETF (NYSEARCA: EPI ). Indonesia and Thailand are also set to gain from the precipitous decline in oil prices. On the other hand, Russia and Venezuela in particular are likely to experience further pain next year. Prepare for Higher Volatility Markets saw some bouts of high volatility this year but in general the indexes maintained their positive momentum. Investors should however prepare themselves for more twists and turns in 2015 as the Fed moves closer to normalization of monetary policy. Geopolitical risks may further add to the uncertainty. Consider adding some low volatility ETFs-like SPDR S&P Low Volatility ETF (NYSEARCA: SPLV ) and iShares MSCI Minimum Volatility ETF (NYSEARCA: USMV ) to the portfolio. These not only shine during highly volatile market environments but also deliver superior risk adjusted returns over longer term.

ValueShares Launches Global Version Of Quantitative Value ETF

Not too long ago, ValueShares launched its active value ETF in the U.S. market, namely the U.S. Quantitative Value ETF (BATS: QVAL ) . The product has seen decent success so far having amassed about $21 million in assets within just 1.5 months. Probably encouraged by this strong response, the issuer has introduced another value based ETF targeting the international market on December 17, 2014. Below we have highlighted the fund in greater detail for investors seeking a new way to play value stocks in international markets: The ValueShares International Quantitative Value ETF (BATS: IVAL ) in Focus The newly launched ETF is actively managed in nature. The fund provides exposure to about 50 international stocks with strong value characteristics. As such, the fund provides an opportunity to invest in some of the cheapest and quality stocks of abroad on long-term valuation metrics. To do so, the issuer uses a systematic technique. The fund manager initially selects a group of mid-to-large cap international stocks, then analyses financial statements and finally identifies stocks which boast lower enterprise values with respect to operating earnings as well as dirt cheap valuations before considering those as investment targets. The fund charges 99 bps in fees for this exposure. How Could it Fit in a Portfolio? The fund could be a good choice for value investors targeting the international market. In fact, value investing has become extremely necessary for investors with a global market focus given deflationary concerns in the Euro zone, Japan and the world’s second largest economy China. A recent boost to Japan’s already accommodative policies, QE talks in the Euro zone and expectations for further easing in Chinese monetary policy in the wake a prolonged downbeat business environment triggered the need for value investing in the foreign markets. So, it is almost certain that volatility will remain high in the coming months. In such a scenario, value products like IVAL should protect investors from market volatility. Notably, a value investing strategy gives investors exposure to stocks that are trading below their intrinsic values and are considered cheaper than other stocks. Value stocks usually have low price-to-earnings ratios, low price-to-book ratios and high dividend yields, as compared to their growth counterparts. Can it Succeed? The road ahead should not be easy for the newly launched fund as there are quite a number of funds already prevalent in the global value equities space. Vanguard FTSE All-World ex US Index Fund (NYSEARCA: VEU ) dominates the global equities ETF space with assets worth $12.0 billion. The fund has a value focus too with a dividend yield of 3.57% (as of December 18, 2014). The fund gives investors exposure to a basket of 2,460 stocks of more than 45 countries, from both developed and emerging markets around the world. The fund charges 15 basis points as fees. There are several other quality and value ETFs in the global equities space namely the FlexShares International Quality Dividend Index Fund (NYSEARCA: IQDF ) , FlexShares International Quality Dividend Defensive Index Fund (NYSEARCA: IQDE ) , MSCI International Quality Dividend ETF (NYSEARCA: QDXU ) , Cambria Global Value ETF (NYSEARCA: GVAL ) and lots more. Investors should note that IVAL is costlier than most of the well-known funds in this space. The product’s actively managed nature might have led to such hefty fees. So, to amass investors’ money in the long run, we believe that IVAL needs to sell its actively managed nature and methodical stock-selection technique, and show some level of outperformance when compared to ETFs built on relatively on relatively similar themes in this space that do not cost as much.