Tag Archives: load

Residential REITs ETF Could Slow As Renters Turn Into Buyers

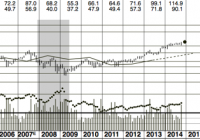
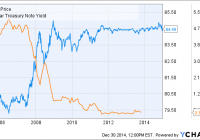
Summary The residential REIT ETF was this year’s best performing financial services fund. However, residential REITs could slow down next year. Rental costs are rising, which in turn could force more renters to buy homes. The residential real estate investment trust exchange traded fund may be this year’s best financial services fund, but things may slow down next year as younger Americans find cheaper financing for a new home. The iShares Residential Real Estate Capped ETF (NYSEArca: REZ ) has increased 37.7% year-to-date as Americans opted to rent instead of purchase a new home this year. REZ offers investors a liquid alternative to physically owning commercial real estate. To qualify as a REIT, a real estate firm has to pay out the majority of its taxable income to shareholders as dividends, and REZ generates its income through renters. Since REITs pay out income to investors, REZ also shows a decent 3.21% 12-month yield. In 2014, U.S. renters paid a collective $441 billion in rent, up $20.6 billion, or 4.9%, from 2013 as renters in San Francisco paid over 14% more in rent, renters in Denver paid 11% more and New Yorkers paid over 10% of all the rent paid in the country, reports Diana Olick for CNBC . Zillow Chief Economist Stan Humphries said in the CNBC article: Over the past 14 years, rents have grown at twice the pace of income due to weak income growth, burgeoning rental demand, and insufficient growth in the supply of rental housing. Next year, we expect rents to rise even faster than home values, meaning that another increase in total rent paid similar to that seen this year isn’t out of the question. In fact, it’s probable. Consequently, the sudden rise in rents could force renters to become new homeowners, especially with cheaper loans available. Specifically, Fannie Mae and Freddie Mac have announced low-down payment loans and mortgage rates are also still attractive. Currently, Fannie Mae and Freddie Mac implement a minimum 5% down payment on home loans. However, the lenders could change it to a 3% minimum, which would allow creditworthy but cash-strapped consumers to acquire a new home. Additionally, mortgage rates remain depressed after Treasury bond yields made a surprising turnaround this year, with benchmark 10-year yields down to 2.2% compared to about 3.0% at the start of 2014. Zillow’s Humphries added: As we prepare for New Year’s and the next home shopping season, we expect soaring rents to entice more people to the relative stability of home ownership, particularly younger potential buyers. iShares Residential Real Estate Capped ETF (click to enlarge) Max Chen contributed to this article .

Valuation Challenges When PEs Are Expanding: 2 Examples

One hallmark of this secular bull market is expanding PE/cash flow multiples. Thus valuations based upon recent historical multiples can be deceiving. I give an example from one stock and one broad ETF. Everyone knows we have been in a cyclical bull market since the spring of 2009. I have argued elsewhere we are now in the early stages of a secular bull market that should continue well into the next decade. One argument supporting this view is to point out that the PE compression which characterized the earlier years of the 21st century has ceased. I shall illustrate this with a few charts shortly. Why is this important to investors? Many analysts judge the attractiveness of the market or a particular stock by comparing PE multiples (or cash flow multiples) with traditional and recent (say, the past decade) multiples. A stock selling at 45x earnings when historically it commanded a multiple closer to 18x is likely to be overvalued and less attractive as an investment or source of dividend income. If we are in a period of rising multiples, however, comparing current PEs to those of the past few years may make companies appear overvalued, when in fact they remain attractive investments going into a brighter future. We can use Teleflex (NYSE: TFX ) as an example. The Value Line chart below shows that TFX traditionally has commanded a cash flow multiple of 10.5x. Well above this (e.g. 2007) was an attractive time to sell, below it (e.g. 2003 and certainly 2009) were great entry points. What should we make of the current multiple, which is closer to 20x cash flow? (click to enlarge) source: Value Line The quick conclusion is that TFX is overvalued and buyers should not pull the trigger. But what if we are in a period of rising multiples, for reasons i made clear yesterday ( here )? This is even more likely given that medical technology is an emerging super field and has been a market leader for several years now. Combining fundamental analysis with charts and some technical snooping might shed more light, and useful trading information, on this challenge. The chart below shows that TFX has been in a bull market since 2009 and ascending in a broad channel as shown in white. If you look at the white channel, TFX touched the upper boundary (it was “overvalued”) in April of this year. But instead of selling off and churning like it did for almost two years back in 2010, the shares have worked their way higher. Maybe we should assume the price range is better defined by the red channel now. Oddly enough, that also suggests it is now fully valued. But the point where a prospective buyer might want to reacquire the shares is quite different. If the higher evaluation (red channel) mode is now in force, that price is approaching $100 as the new year unfolds. Using the old valuation channel, a buyer wouldn’t be interested until the price falls well into the $70s. This might be mere curve fitting but for the fact that broad indexes and ETFs such as the S&P500 Trust (NYSEARCA: SPY ) show almost exactly the same phenomenon. Compare the white and red channels in SPY below. (click to enlarge) source: freestockcharts.com Is this new channel reflective of higher valuations? Yes: (click to enlarge) source: etrade . While some expansion might have occurred in the early years of the bull market because earnings (the denominator in PE) are lagging indicators, it certainly is not the case now: corporate earnings growth is strong. And likely to get stronger! Already third quarter GDP growth came in at 5%, and second quarter GDP was revised higher. The full effect of lower oil prices still has to fully work into the economy, and the fiscal prudence of a Republican House (and now Senate) seems destined to continue. While it may be an ad hoc/seat of the pants process, investors would be well advised to revise their tolerable PE/cash flow multiples on stocks higher in the next few years. Get ready to buy Teleflex shares if a correction brings prices back to the high nineties.

Why I’m Margin SHY

Summary Margin interest rates at major brokers are several percent. One could instead short SHY at the cost of one half a percent. Tail-risk could make this dangerous. ETF Description SHY is the short-duration treasury ETF managed by iShares. It holds treasuries with a duration between 1 and 3 years. It currently yields 0.46%. It effectively mirrors the behavior of the two year yield. SHY data by YCharts Thesis Below is a table taken from Tradeking of current margin rates at major brokers: One could save substantially by instead shorting SHY. For a hypothetical portfolio which has two dollars of equity for each dollar of margin the current interest charge might be 8%. By lowering that to 0.5% by shorting $1 of SHY for each two dollars of equity, our hypothetical portfolio would perform 3.75% better (on equity). Maintaining this level of out-performance would result in having twice as much money over twenty years! One may also benefit from capital gains because short term yields seem, on balance, more likely to rise than fall over the next ten years or so. Investment Risks Is this a free lunch? I’m honestly not quite certain. On May 6th, 2010 the Dow Jones Industrial average dropped 9% and recovered over the course of minutes. Some stocks, like Procter & Gamble, traded down to a penny. If for some reason there was a flash spike in the value of SHY and your broker forced liquidation, you could be wiped out. It’s hard to quantify the likelihood of such a situation. This is in general a problem of using margin, as a flash crash could wipe you out if your broker forced you to sell at pennies. One might be inclined to think that the risk could be decreased by using multiple short-duration treasury ETFs. This is not the case. It simply adds more danger, because any one of them could theoretically trade at an insane level. The fact that each ETF would represent a smaller amount of money doesn’t help, because it only takes one share trading for $100,000 (as some stocks did during the flash crash) to wipe you out. An important question to ask your broker is what they would do in such a situation. Second, if short-term yields declined further the value of SHY could increase. Suppose that short term interest rates went to negative 3% overnight. If the average duration is roughly two years so if the ETF reflects net asset value the value should increase to something like 6% above par. This would translate to a 6% increase in the ETF’s value. This might be scary if it happens overnight but isn’t much larger than you might have paid for interest over the course of the year. Much larger negative interest rates could cause more significant losses. If we saw short term interest rates go to negative 30% the Net Asset Value of the fund would double. If your broker forces you to sell at that point your losses could be substantial. Third, a deflationary environment might cause a similar problem. The value of short term treasuries might spike. To get a substantial loss (eg. 50%) we’d still need to see something like 17% deflation or 17% negative interest rates. Fourth, if your stock portfolio drops in value you might be forced to sell some positions at depressed values to cover your short position. This is more likely than when using margin! Take the time to calculate how much margin or short SHY you should use under different scenarios. You should at least assume that at some point the US stock market will fall 50%. If it does what will happen to your portfolio? If you are using one dollar of margin per dollar of equity then you are wiped out. Similarly, if you are short one dollar of SHY per dollar of equity you are also wiped out. You might be inclined at this point to say, well alright, I’ll just make sure that my margin/SHY is 49% of the value of my stocks. If this happens, your broker is still likely to force a sale at depressed levels, which could leave you with as little as 2% of your original portfolio value. You need to check what the maintenance requirement for margin is with your broker. For example, at Tradeking the maintenance requirement for stocks above $6 is 30% of the current value. After the drawdown you need to end up with at least 30% equity in your account. This means that you could only have started with a ratio of $2 of equity against $1 of margin to avoid a margin call. Any more margin than this is very risky and over long periods will likely wipe you out. If we handle this instead by shorting SHY the calculation is a little different. The amount of equity can’t (in the case of Tradeking) go below 140% of the market value of SHY. This means that we can only use $1 of shorted SHY for every $4 of equity. Even if you don’t intend to own stocks on margin, but instead use the shorted SHY for something else, you still need to pay attention to this rule. (click to enlarge) I don’t own any stocks on margin, but I am shorting a small amount of SHY to take advantage of a 3% interest rate on a checking account. The maximum amount that I feel comfortable using is 20% of the total stock value of the account.