Active Vs. Passive Investing: The Real Scoop
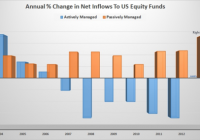
As of October 31st, investors had plowed over 60 billion into passive index funds this year while yanking over 80 billion away from actively managed funds. Statistics, on their face, can mislead us quicker than they can enlighten. Of all the US Large Cap Equity funds that had both high ownership and low cost, over 75% of them outpaced the indexes on a 5 year rolling return and. Like fitness bands and frappuccinos, index funds are high fashion. As of October 31st, investors had plowed over 60 billion into passive index funds this year while yanking over 80 billion away from actively managed funds. And why not? It’s well known most active managers do not outpace their benchmarks. Index funds are cheap, simple, and the upkeep is nominal. Indeed, more than ever, the joes, and pros, are turning to index based investing. On the other hand, we cannot deny the fact that investors feverishly jump into trends at precisely the wrong time. So, are index fund investors truly onto something or are they somehow being misguided? First, and for a quick refresher; index funds are investment vehicles that provide a way to closely mimic the returns of a specific index – such as the S&P 500. There are hundreds of indexes and over a thousand index funds. Each index is designed to track an area of a certain market and is formed by its own set of specific criteria. Since the criteria is based on objective data, there’s no need for an index fund to pay big money or bonuses to an investment manager as they need only copy their corresponding index. Consequently, the management of an index fund is largely administrative; hence, the low expense ratios and portfolio turnover. (Note: The data and observations provided are not exhaustive. All references herein are in regards to equity based funds only. ) Much of the frenzy over index funds has come from academic research showing that actively managed funds do not typically beat their respective index. For example, in a recent study by Standard & Poors, less than 30% of active fund managers outperformed their indexes in any given year between March 2009 and March 2014. Of the managers who did outperform the market, only a few did so with any significant edge. Of greater “consequence” to investors, over the 5 year period, less than 1% of the managers were able to return to the top quartile of funds for 5 consecutive years. What this means is that in that period of time, if you had simply invested in an S&P 500 index fund, which required no active portfolio management, you would have earned a better return than more than half of the portfolio managers. And this is just a small example, as there are many studies out there that point to the same thing – cheap, simple, index funds put the odds in your favor. Active managers rarely consistently beat the indexes therefore their typical 1.5% annual fee cannot be justified. So, considering the overwhelming evidence against active managers, it would be downright foolish not to join in with the index fund movement…..right? Well, not so fast. “There are lies, damned lies, and statistics.” – Mark Twain Statistics, on their face, can mislead us quicker than they can enlighten. Notwithstanding the reality that most active managers do in fact drift under the indexes, we must push onward, and look deeper into what information is being shown, or not. First, we need to acknowledge that these numbers do not include separate and private wealth managers. So, right off the bat we’re missing some of the very best in the business. (Ahem) That aside, what about the managers who do in fact consistently outpace their indexes? Are they just a lucky few? Maybe. But what if we could find a common characteristic, or positive correlation between them? Perhaps that would grab the attention of even the most dogmatic of index investors. Morningstar’s 2014 US Mutual Fund Stewardship Survey shows and highlights precisely these types of correlations. In the study, they discover two notable common characteristics between the top ranking active managers: High Manager Ownership – This firms where 80% of the assets managed have at least 1 manager owning 1 million dollars or more of the shares. Low Expenses – This is firms charging 1% or less. The report shows managers with these two characteristics exhibit very high levels of success. How high? Capital Group, a division of the behemoth American funds, took this research and dug even deeper to find some very powerful information. Their research piece, The Active Advantage , sifts through Morningstar’s research and highlights many interesting tidbits. One item they found stands out quite powerfully all alone: Of all the US Large Cap Equity funds that had both high ownership and low cost, over 75% of them outpaced the indexes on a 5 year rolling return and 100% of them beat the indexes on a 10 year rolling return. Therefore, by simply screening for funds with reasonable expenses and good ownership, we can completely reverse the aforementioned stats against active managers. While the oft maligned world of active management does have some merit, it seems unwise to forever close one’s mind to a concept that works incredibly well for so many. We simply need to find a better way to measure the quality of an active manager. Expenses, firm structure, and manager incentive is a start. The truth is, much of investing is about getting yourself, and your portfolio, on firm ground. Don’t make beating the market your only goal. Try to put the odds in your favor by focusing on things you can control such as expenses, taxes, portfolio cash flow, and of course proper incentive if you have an investment advisor or manager. Finally, it’s old hat, but I must say that chasing market returns, whether passively or actively, isn’t usually a good idea. Pouncing on the highest number as of late, is exactly that – late. Yet, oddly enough that is precisely how the industry works. Investors want to see good past performance, and many advisors screen and sell off off these high numbers. Active managers are continually being threatened by the rise of index funds so they’ve become even further pressured to outpace the indexes. That is, until the indexes turn around and head in the other direction. Unquestionably, much of this is a circular problem – with the average investor stuck in the loop.