Tag Archives: load

The Gone Fishin’ Portfolio: 14 Years Of Market-Beating Returns

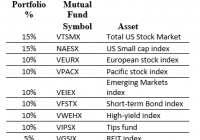
I’ve always been fascinated by ‘Couch Potato’ portfolios, those where you invest in index mutual funds and rebalance only once per year. In the early 2000’s I read about the ‘Gone Fishin’ Portfolio. ‘Gone Fishin’ was intriguing because it is based on the work of Harry Markowitz, who won a Nobel Prize in 1990 for Modern Portfolio Theory – now known as asset allocation. Asset allocation is the process of developing the most effective – optimal – mix of investments. In this case, optimal means that there is not another combination of asset classes that is expected to generate a higher ratio of return to risk. Quite simply, it’s breaking down your portfolio into different baskets, or classes of investments, to maximize returns and minimize risk. Asset allocation is based upon the principal that non-correlated investments of varying risk, when astutely mixed together, will smooth out the volatility (or variability) of your returns. And the best part about it is that it also increases your returns. Alexander Green of The Oxford Club took the work of Markowitz and gave it a name – ‘The Gone Fishin’ Portfolio.’ The allocations are: So we have 30% U.S. Stocks, 30% International Stocks, 30% Bonds, then 5% REITs and 5% Gold/Precious metals. A nice well-balanced portfolio. Advantages of the ‘Gone Fishin’ Portfolio, and other Lazy portfolios, are that they help address four major investment risks: Being too conservative. Being too aggressive. Trying and failing to time the market. Using expensive fund managers (Recommend Vanguard funds) Back 14 years ago when I first heard of the Gone Fishin’ Portfolio, I thought that replacing the index funds with active managers (while keeping the same % allocation) might even be better than this passive index approach. I knew lots of great fund managers whom I thought would beat their index in the long term, so why not utilize their expertise within the Gone Fishin’ framework? I called this creation the ‘Masters Select’ Gone Fishin’ Portfolio. I then created an Excel spreadsheet to track both styles, and have updated it each January for the last 14 years. Here’s the ‘Masters Select’ Gone Fishin’ Portfolio I set up 14 years ago: So you can see in most cases I replaced the passive index fund with a favorite active manager. Fairholme Fund for the Total U.S. market, and Third Avenue Value for small caps. Matthews Asian Growth & Income for the Pacific stock index. And Third Avenue Real Estate replaced the REIT index. Back 14 years ago I could not identify a worthy active manager for the European or Emerging Markets indices, so I left these as the passive index. For Bonds, I took the combined 30% allocation and divvied it between two excellent bond managers – Bill Gross of Managers Fremont Bond, and John Hussman of Hussman Strategic Total Return. And I replaced the normal Gone Fishin’ precious metals fund with a broad commodity fund. I’ve been tracking the results of both the official Gone Fishin’ portfolio and my ‘Masters Select’ version. Here are the results. The standard Gone Fishin’ portfolio has performed as advertised, soundly beating both the S&P 500 and a 60/40 Stock/Bond portfolio. On a risk-adjusted basis the Gone Fishin’ portfolio does extremely well (the whole idea behind Markowitz theory), with the drawdowns in bad years less than the stock market. My ‘Masters Select’ Gone Fishin portfolio did even better than the Markowitz model. Half the time (7 of 14 years) it beat the other three portfolios, and had a total return better than the standard model. I should emphasize I did not replace an active manager during the entire 14 year period, so there’s no bias there. Of course perhaps I was lucky (or good) with the picks. Further, by using active managers, I realize I was introducing ‘tracking risk’ to the portfolio, where a manager strays away from the intended index. Nevertheless it paid off to combine these pros with a Nobel prize-winning framework. Of some concern – the Gone Fishin’ portfolios started off with a blast, beating the S&P 500 for 10 straight years (2001 – 2010). But since then they have underperformed. This also happened in the late 1990’s when the S&P 500 was in its strongest bull phase and international stocks were out of favor. We seem to be in a similar era right now and I expect the underperformance to be temporary. One other concern I have with the ‘Masters Select’ Gone Fishin’ concept is the fund size. Fairholme Fund and Third Avenue Value have grown incredibly in the past 14 years. Size is an anchor to performance, particular with small-cap funds. If I started this today I may choose a few different funds, or a combination of active funds.

5 Catalysts That Will Lift India ETFs In 2015 Even After 2014’s Big Gains

Summary India trades at low valuations compared to the U.S. and developed markets. India is home to a burgeoning consumer population entering their prime earning and spending years. India’s consumer market is under penetrated compared to the oversaturated developed markets. Prime Minister Narendra Modi’s business-friendly regime will attract foreign investors. The central bank lowered interest rates, which will stoke business growth. (click to enlarge) India’s ETFs and stock market were among the top destinations of 2014. The WisdomTree India Earnings ETF (NYSEARCA: EPI ) jumped 28% in 2014, while the iShares MSCI India Index ETF (BATS: INDA ) climbed 22%. They far outdid foreign developed markets, which fell 5%, and emerging markets, which shed 4%. 2014’s returns were driven by a perfect storm of government reforms and a dive in oil prices – a major import – that relieved a huge burden on government subsidies. The planet’s biggest democracy shows no signs of slowing down in 2015. Among numerous reasons I’m bullish on India, here are the top five. 1. Attractive Valuations EPI in changing hands at a price-to-earnings ratio of 14, price-to-book value of 2 and price-to-sales of 1.1. It’s trading at higher valuations than China and other emerging markets, but is lower than foreign developed markets and the U.S. The iShares MSCI EAFE ETF (NYSEARCA: EFA ) sports a P/E of nearly 15, P/B of 1.6 and P/S of 1. The SPDR S&P 500 Trust ETF (NYSEARCA: SPY ) has a price-to-earnings ratio of 17, price-to-book value of 2.5 and price-to-sales of 1.8. Corporate earnings in India are expected to accelerate and perhaps double over the next few years, indicating companies deserve higher valuations. 2. Ideal Demographics More than half of India’s people are under age 25 and more than 65% are younger than 35. Demographers forecast by 2020 India’s median age will be 29 years, compared to 37 for China and 48 for Japan. A younger population goes hand in hand with more consumer spending as people form households and raise children. In addition, there are more workers supporting fewer retirees. Currently home to 17.5% of the world’s population, India is projected to be the world’s most inhabited country by 2025 with 1.396 billion people, outnumbering China with 1.394 billion. India has more young consumers in addition to an underserved market compared to the oversaturated Western markets. As of 2009, only 11 people per 1,000 owned cars in India versus 34 for every 1,000 in China and 440 for every 1,000 in the U.S. 3. Business-Friendly Reforms Prime Minister Narendra Modi’s win in the May election brought hope that the country would lighten gold import restrictions, ease environmental regulations to better compete with China and take on more infrastructure development. Modi lifted a ban in June on industrial growth in 43 areas that the Ministry of Environment and Forests had in place since 2010. Modi designated a new like-minded environmental minister and industrial projects that were once stalled are now being approved quicker. The government in November did away with the 80:20 gold importation law. The controversial rule required that 20% of gold imported be exported before new gold deliveries could be brought in. In November, gold imports vaulted to 150 tons – a fivefold jump year over year. Modi issued in late December five ordinances, akin to executive orders, to kickstart the economy. The most significant one eased land acquisition rules to reduce bureaucratic bottlenecks that had hindered development projects totaling almost $300 billion. One ordinance would allow private sector involvement in coal mining, while another aims to increase foreign investments in the insurance sector. India’s parliament has to pass the new ordinances at their next confab in February for the ordinances to be enacted. Some 311 million people in India live without electricity, but the government wants to provide access to the entire country by 2017. In an effort to achieve that, Modi is asking the government – which controls 90% of the coal reserves but is very inefficient – to auction its coal mines to private mining companies. India has the fifth largest coal reserves on the planet. The country is estimated to have lost $68 billion in economic output, or 4% of GDP, in 2013 because of power outages. Any electricity grid improvements would greatly benefit economic activity. India stands to draw more foreign investments thanks to a business-friendly regime at the helm. 4. The “Make in India” Program Modi unveiled in September the “Make in India” campaign to create jobs and boost manufacturing. The government has promised to remove entry barriers to business, and create a competitive tax environment to encourage manufacturing of low-cost products for both the foreign and domestic markets. 5. Central Bank Easing The Reserve Bank of India (RBI) surprised markets around the world this month by cutting its key interest rate by 0.25 percentage points to 7.75%. It marked the first rate reduction in almost two years, as the country experiences lower inflationary pressure thanks to lower food and oil prices. Lower interest rates will improve corporate balance sheets and encourage business expansion, especially in interest-rate sensitive industries such as banking and real estate. India’s economy will expand by 6.4% in 2015 after growing 5.6% last year, the International Monetary Fund forecasts.

How To Design A Market Neutral Portfolio – Part 2

Summary Sector diversification is a key in market neutral investing. Two examples. Questions to solve for IRA compatibility. My previous article described the investor profile to hold a market neutral portfolio and some characteristics of this investing style illustrated by examples. I also explained why I prefer using an index ETF for the short side of the portfolio. In the next step, I want to focus on the benefit of sector diversification in market neutral investing. Sector diversification is especially important when the objective is to beat the benchmark in all market conditions, that is to say in all phases of the expansion-contraction cycle. The reality is more complicated than the figure. Cycles of different and variable periods may be in play, and macro trends can freeze the cycle for some sectors (like oil price does for energy and materials). In fact, it is sometimes quite difficult to figure out where we are and on which time frame when various cycles are combined. This is why, if an index ETF is on the short side, the long side of the portfolio must be diversified, not necessarily in all sectors, but at least in a few cyclical and defensive sectors. Since the return of such a Market Neutral Portfolio is the alpha of the long side, diversification in defensive and cyclical stocks is a key to keeping drawdowns acceptable in duration. In my opinion, the historical maximum duration in drawdown of an investing strategy is a parameter as important as the return and volatility. Examples I have performed a simulation of a portfolio mixing all the S&P 500 strategies of my book «The Lazy Fundamental Analyst» (Harriman House 2014). There are 9 strategies, one for each sector of the GICS classification, except Telecommunication (which is very small to elaborate statistical models). Each strategy selects 10 S&P 500 companies using a simple ranking process based on 2 fundamental factors. The factors are sector-dependent, chosen using historical statistics. The result is an equal-weighted portfolio of 90 stocks in a universe or 500, updated and rebalanced every 4 weeks. It is quite a big set (18% of the S&P 500 index) with various logics mixed, so the performance can hardly be suspected of being curve-fitted or random. Of course, past performance, real or simulated, is not a guarantee for future returns. But on such a portfolio it gives a good clue on the risk. The next chart shows the simulation of the 90-stock S&P 500 Lazy Portfolio (long side only) since 1999, with a 0.1% transaction cost and a 4-week rebalancing: (click to enlarge) The next table gives statistics of the excess return of the portfolio over the SPDR S&P 500 Trust ETF (NYSEARCA: SPY ) by 4-week periods, which corresponds to the market neutral portfolio with a leveraging factor 2, without the margin and carry cost for the “short half”. Average 4week return Average Annual return Max Drawdown Depth Max Drawdown Duration Avg gain / Avg loss 4week gain probability Kelly criterion Kelly crit. 95% confidence 0.94% 12.9% 20.5% 19 months 1.52 67% 0.46 0.35 Holding 90 stocks is a lot. In my real market neutral portfolio, I have reduced the number by: Excluding the most sensitive sectors to macroeconomic and geopolitical concerns: finance, energy and materials. My aim is not to get the best possible return, but a good return with a risk as low as possible. Optimizing the models to keep only 24 stocks with a diversification pattern, including at least 2 defensive sectors, 2 cyclical sectors and a minimum number of stocks in each of them. Optimizing to a lower number of stocks incurs a risk of curve fitting. However, with 24 holdings and various ranking logics, the risk remains quite low. The biggest danger of optimizing is not over-rating the possible return, but under-rating the real risk. In a diversified market neutral portfolio, the risk is limited by design. The next chart shows the simulation of my 24-stock portfolio (long side only) since 1999, with a 0.3% transaction cost and a 2-week rebalancing: (click to enlarge) This portfolio is more dynamic (rebalanced twice more often). It is also focused on large caps, but may hold a limited number of liquid small caps from the Russell 3000 index. Even if I use volume filters, I use a higher transaction cost to model a higher spread and slippage. The next table gives statistics of the excess return of the portfolio over SPY by 2-week periods, which corresponds to the market neutral portfolio leveraged twice, without the margin and carry cost. Average 2week return Average Annual return Max Drawdown Depth Max Drawdown Duration Avg gain/Avg loss 2week gain probability Kelly criterion Kelly crit. 95% confidence 0.79% 22% 11% 13 months 1.69 64.2% 0.43 0.36 These are examples. Ideas and steps can be reused with other quantitative models, or with a stock picking based on due diligence. The main idea here is to formalize and follow a sector-based diversification pattern. A next article will explain how to use leveraged ETFs to implement this strategy with a lower or no leverage (ProShares Ultra S&P 500 ETF (NYSEARCA: SSO ), ProShares UltraPro S&P 500 ETF (NYSEARCA: UPRO )), and the consequences of using inverse ETFs to avoid short selling (ProShares Short S&P 500 ETF (NYSEARCA: SH ), ProShares UltraShort S&P 500 ETF (NYSEARCA: SDS ), ProShares UltraPro Short S&P 500 ETF (NYSEARCA: SPXU )). Indeed market neutral investing can be implemented in an IRA account. Feel free to follow me if you don’t want to miss it. Data and charts: Portfolio123 Additional disclosure: Long SPXU as a hedge. Past performance is not a guarantee of future returns.