Tag Archives: load

What Is Driving Up SLV Besides Gold?

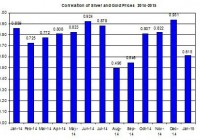
The fall in the U.S. treasuries yields keeps up the price of SLV. The rally of gold is only partly related to the recovery of silver. Despite the recovery in silver prices, SLV’s silver holdings didn’t pick up. The silver market has started off the year on a positive note as shares of iShares Silver Trust (NYSEARCA: SLV ) added nearly 14% to their value (up to date). Is most of this recovery related to the rise in gold? Let’s reexamine the relation between silver and gold and further explore other factors that drive up SLV. Despite the progress of SLV in the past few weeks, its rally seems, at first glance, less related to the rise in gold prices. The chart below shows the linear correlation of gold and silver on a month-to-month basis (daily percent changes). Source: Bloomberg In the past month the linear correlation was around 0.615; even though this is still a significant and strong correlation, it’s also well below the levels recorded in the preceding months. Moreover, the ratio between SPDR Gold Trust (NYSEARCA: GLD ) and SLV has zigzagged with an unclear trend in recent weeks, as indicated in the chart below. Source: Google finance The ratio is still at a high level of around 7.2, which means GLD has still outperformed SLV in the past year. Some investors, however, might consider the high level of the GLD-to-SLV ratio as an indication that the latter is actually cheaper than the former. I put less faith in this assessment. This ratio could keep going up or remain at this level for a long time. After all, back in the early 90s the ratio between gold and silver started off at around 70 – this is the current ratio – and kept rising up to the low 90s and remained in the 70s and 80s range up to 1997. This doesn’t negate the fact that SLV’s recovery in the past few weeks was driven, in part, by the rise in gold. It only goes to show that other factors may have come into play in pushing up silver prices. One other factor to consider is the ongoing drop in long- and mid-term U.S. treasuries yields – they may have also contributed to the rise in SLV prices. The chart below shows the progress in the 7-year U.S. treasury yield and the price of SLV in the past several months. During the period presented below, the linear correlation between the two was around -0.3 – a mid-strong correlation. Source: Bloomberg and U.S Department of the Treasury Even though the FOMC is still expected to raise its interest rates, which are likely to bring back up the U.S. treasury yields in the second half of 2015, the recent developments in the markets including low inflation – mainly due the fall in oil prices – and higher economic uncertainty drove down U.S. treasuries yields. If yields continue to come down in the short term, this could keep pushing up the price of SLV. The recent developments in Europe including the Swiss National Bank’s decision to stop pegging its currency and ECB’s upcoming announcement of its QE program also seem to drive the demand for precious metals. In terms of growth of physical metal, this seems to play a secondary role, at best, in moving the price of silver. After all, China is one of the leading silver importers. The country recently published its fourth-quarter growth rate update; it showed a 7.4% growth in annual terms. This is slightly higher than market expectations of 7.3%. But this is still lower than its growth rate of 7.7%, which was recorded in the same quarter in 2013. This year, the World Bank estimates China’s GDP will expand by only 7.1% – this is 0.4 percentage points below its previous estimate back in June 2014. The IMF also revised down the global economic growth from 3.8% to 3.5% this year. A slower growth rate for China could suggest, at face value, a slower rise in the demand for silver. Lower growth in the world economy isn’t expected to increase the industrial demand for silver but it’s likely to drive more investors towards silver. This only serves as another indication that the demand for silver on paper leads the way for the price of SLV. But is the demand actually picking up for SLV? The chart below presents the changes in SLV’s silver holdings in the past few months. Source: SLV’s website Since the beginning of the year, silver holdings have actually slightly come down by 1.4% to 325 million ounces of silver. This could be an indication that some SLV investors have taken money off the table after the price of silver rallied. Looking forward, however, the recovery of silver is likely to slowly bring more people back to SLV. The silver market has seen a recovery in recent weeks. Over the short term, silver could keep rising especially if the global economy keeps showing slower growth. For more see: 3 Reasons to Prefer Silver Wheaton
Can India ETFs Continue To Soar After The Rate Cut?

The Indian stock market took giant strides last year gaining about 30% on optimism that the much-anticipated win of the pro-growth government would drive Asia’s third-largest economy higher. After all, the euphoria around one of the members of the BRIC nations was justified when investors saw robust corporate earnings, a drastic decline in inflation helped by the unbelievable decline in global oil prices and a stable currency despite the ascent of the greenback. All these tailwinds set the stage for the Indian central bank to go for the much-awaited rate cut on Thursday, Jan 15, by 25 basis points to 7.75%. The move, was prompted by consumer prices below the Reserve Bank of India’s ( RBI ) target for the third month in a row. RBI governor Raghuram Rajan also sounded hopeful that inflation might remain below 6% until January 2016. Though India’s inflation rate nudged up to 5% in December 2014 from a record-low of 4.38% in the earlier month, the number was way behind the average 8.98% noticed from 2012 until 2014 (per tradingeconomics). In fact, the number even touched the high of 11.16% in November 2013, compelling a cycle of rate hikes in the past one-and-half years that India had to undergo in order to contain rising prices. What’s Behind the Falling Inflation? India’s present economic background, created on both domestic and international parameters, is in one word – satisfactory. While a drastic slump in oil price caught the global stock market on the wrong foot, it came as a boon to the Indian economy. This was because India imports more than 75% of its oil requirements, thus being highly susceptible to oil prices. Per U.S. Energy Information Administration, India was the world’s fourth-biggest user of crude oil and petroleum products in 2013. Last June, Financial Times indicated that the Barclays’ projected $10 per barrel rise in crude oil price would cost India 0.5 percentage points in its growth rate. When the oil price moved in the opposite direction, the scene turned around as well. And now, with several research houses projecting oil prices to remain around $40 per barrel in the first half of 2015, Indian foreign reserves paired with policy makers have every reason to cheer. This in turn is easing pressure on India’s currency, that too at a crucial time like this when the greenback is soaring higher and might gain more strength after the inevitable Fed rate hike. Market Impact India’s benchmark stock index rose the most in eight months following the rate cut announcement. No doubt the latest rate cut and a host of transformational measures including coal reforms, opening up the road for 100% FDI in railway infrastructure and easing FDI policies in construction, defense and insurance will provide a good boost to investors’ sentiments. As a result, India ETFs are poised to surge in the coming days on this surprise rate cut. Investors should note that almost all India ETFs are Buy-rated at the current level. Below are three funds that could strengthen investors’ portfolio with enhanced returns. These products have generated excellent returns over the trailing one-year period and are off to a good start in 2015 as well. WisdomTree India Earnings ETF (NYSEARCA: EPI ) This product tracks the WisdomTree India Earnings Index, holding 230 securities in its basket. The fund measures the performance of the profitable Indian companies. As we all know, a rate cut should spur corporate India, EPI should make a wise investment proposition in the coming weeks. About one-fourth of the portfolio is dominated by financials, followed by energy (18.70%) and information technology (17.94%). EPI is the largest and most popular ETF targeting India with AUM of over $2.1 billion and average trading volume of around 4.5 million shares. The expense ratio comes in at 0.83% for this product. The fund was up 31.7% over the past one year and has added about 6.7% so far this year. The fund has a Zacks ETF Rank #1 (Strong Buy) with High risk outlook. iShares S&P India Nifty Fifty Index ETF (NASDAQ: INDY ) INDY is a large cap centric fund that follows the CNX Nifty Index, which seeks to track the performance of the largest 50 Indian stocks. As the fund tracks the key Indian stock market gauge, it should be an eye-catcher for foreign investors. The ETF has amassed $778 million in assets. The fund charges 94 bps in fees. Banks take the top spot in the portfolio. This Zacks ETF Rank #1 (Strong Buy) fund was up nearly 32% in the last one year and 7.6% in the year-to-date frame. EGShares India Consumer ETF (NYSEARCA: INCO ) This ETF targets the consumer industry of India and follows the Indxx India Consumer Index. It holds 30 stocks in its basket and has amassed $27.1 million in its asset base. The fund trades in a paltry volume of 20,000 shares in an average day, suggesting additional cost in the form of a wide bid/ask spread beyond the expense ratio of 0.89%. As the name suggests, the product is focused on the consumer sector. From an industry look, automobiles, which perform better in low rate environment, occupy the top position with 37.5% share while personal goods and industrial engineering round off the next two places at 27.1% and 15.4%, respectively. This Zacks ETF Rank #1 fund was up 56% in the one-year frame and 12% in the year-to-date frame.

The Rise Of Factor Investing And The Implications For Asset Allocation

Once upon a time there was only one factor-the market, a la the capital asset pricing model. But after a half century of crunching the numbers since CAPM was born, “now we have a zoo of new factors,” as Professor John Cochrane observed a few years ago. In theory, identifying more factors opens the door for building superior risk-adjusted portfolios. But some practitioners worry that “the proliferation of factors is deeply troubling,” as Research Affiliates explained recently. Why? Because not all factors are created equal and securitizing what looks like a productive risk premium on paper is tricky when it comes to real-world results. Finding success in the factor zoo, in other words, is quite a bit more challenging than it appears when reading finance journals. But for those who are willing to try, there are numerous ETFs and mutual funds to choose from in the new world order. Taking the marketing material at face value tells us that clever strategists can build smart-beta portfolios that leave their standard-beta counterparts in the dust. That’s certainly possible, but the pernicious rumor promoted by some folks that happy outcomes are inevitable is misleading at best. The main problem is that quite a lot of what some see as compelling evidence in favor of going off the deep end with smart beta funds is really just cherry-picking the strongest performers. You can certainly find ETFs and mutual funds that deliver encouraging results in the art/science of mining smart beta. But there are plenty of dogs as well. The real question is whether there’s any evidence that, all else equal, an asset allocation strategy populated with smart-beta funds reliably outperforms its conventional-beta counterparts in a convincing degree on a risk-adjusted basis? Coming up with an answer is tougher than it sounds, in part because there aren’t a lot of smart-beta ETFs and mutual funds with sufficiently long records to run a robust test. The original factor strategies-i.e., small-cap and value-have been around for a few decades and so there’s a relatively deep and wide empirical record to study on this front. And the results are encouraging, particularly when it comes to value. But there’s a bigger mystery with the newer generation of factor funds that target an array of risk premiums, such as momentum, quality, and volatility. And more are on the way. Some of this is little more than data mining. Looking for relatively strong relationships in the cross section of security returns is child’s play at this point, thanks to the rise of inexpensive computing power. But the transition from encouraging in-sample results to out-of-sample confirmations using real-world funds is a slippery affair. Most of the studies to date focus on a single asset class; kicking the tires when it comes to asset allocation is still in its infancy with regards to smart beta analysis. As a preliminary test, I recently ran a test using a set of smart-beta funds that track indexes designed by one of the more respected names in the business. The analysis is compelling because the smart-beta funds I review have been around for at least five years and hug benchmarks designed by a single firm. Meanwhile, there are low-cost alternatives that track conventional cap-weighted indexes. In short, we have the ingredients for a robust test of real-world results. It’s hardly definitive, but it offers some perspective on how smart beta fares in asset allocation. I created two sets of equity portfolios-a smart-beta strategy and its standard-beta counterpart for a U.S./foreign equity allocation using five allocation buckets (U.S. broad, U.S. small cap, U.S. value, foreign developed, foreign Asia ex-Japan). The initial portfolio weights are identical. I ran the numbers with a year-end rebalancing strategy vs. a buy-and-hold portfolio. In both cases the results are the virtually the same, namely: there’s not a lot of difference between smart-beta and conventional-beta portfolios over the past five-year period. In a future post, I’ll lay out the details with a review of the numbers, at which point I’ll name names. For now, let’s just say that the data suggests that building portfolios with smart-beta funds may not be a silver-bullet solution that reliably outperforms a comparable strategy using conventional index funds. Why? Several reasons. First, smart-beta funds have higher expense ratios, although for the test I ran the funds under scrutiny charged only moderately higher fees vs. the traditional index funds. Another challenge is the simple fact that smart beta doesn’t always outperform, at least not reliably so across all asset classes at all times. This is a major challenge for analysis in this corner because there’s a growing number of vendors using a wide set of criteria for designing funds. Ideally, investors will select only those products that will deliver superior results and otherwise use standard index funds. But this is harder than it sounds, particularly for time horizons over, say, one to three years. In my test, some of the smart-beta funds outperformed (some of the time), but others stumbled. The result: the wins cancelled out the gains and the overall results tracked the portfolios built with conventional index funds. Selecting one or two smart-beta funds and earning superior results over standard index products is one thing, but it’s a tougher game when applied to a broad asset allocation strategy over a longer-term horizon. Some of this is due to the variation in the design quality of products, but there’s also lots of debate about what’s likely to work in the smart-beta zoo vs. what’s an anomaly that won’t survive beyond the realm of backtesting. As a recent paper (“Facts and Fantasies About Factor Investing”) by researchers at Lyxor Asset Management explains: From a professional point of view, only a few number of risk factors and anomalies are reliable. Among these relevant factors, we find for example [small-cap, value and momentum]. But, even with a reduced set of less than 10 factors, there are again a lot of questions to answer in order to understand what the nature, the behavior and the risk of these factors are. Academics have done extensive studies on these questions and their work can help to find the answers, but some questions still remain open, in particular the level of the risk premia. That last point, about the level of risk premia, is critical. Indeed, after adjusting for commissions, taxes and various real-world frictions, there’s a high bar for arguing that a given factor is a viable candidate for use in real-world portfolios. The bottom line is that the evolution from conventional-beta products to smart-beta funds comes with a number of hazards. By contrast, the transition from conventional active management to plain-vanilla indexing over the past generation has been and remains a more reliable process, particularly in the context of designing and managing multi-asset class portfolios. That doesn’t mean that smart beta isn’t a productive development in assert pricing and money management. But it turns out that there’s a lot more art than science in the next generation of indexing than some folks would have you believe. As a result, beating Mr. Market’s asset allocation over the long run will likely remain as challenging as ever.