Tag Archives: load

Shorting China Based On GDP Growth Rate Projections Is Highly Risky

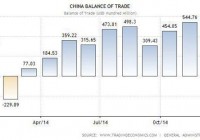
Summary China is looking at record trade surpluses in 2015, which should boost GDP growth. Many China shorts assume GDP growth moves in one direction instead of up and down. Shorting based on projections is risky, especially when there are many factors that can throw off these projections. China’s trade surplus is currently trending up. After a relatively quiet first quarter in 2014, the balance of trade improved drastically throughout the remainder of the year. In fact, the country recorded a record monthly trade surplus of $54.5 billion last November . For the whole of 2014, the trade surplus soared by 47 percent over the previous year and wound up at a record $382.46 billion. (click to enlarge) What’s driving the trade surplus and why they may continue The drastic change in the balance of trade is not all that surprising when the fall in commodity prices is taken into account. Since China is the biggest importer of many commodities, it makes a big difference when it is able to pay less. To illustrate the drop in commodities, the Continuous Commodities Index is down by almost 14 percent over the last 12 months and continues to go down. Crude oil, the most important commodity, is down by more than half. The drop occurred in the second half of the year and accelerated by late November. This will have an impact since China imported 6.17 million barrels per day in 2014, an increase of 9.5 percent over the prior year. With commodities going the way they are, China can expect continued bumper trade surpluses. Trade surpluses should be especially high for at least the next two quarters due to the high base of the preceding year. Barring a drastic rebound in commodity prices, the trade surplus in 2015 is very likely to be substantially higher than the one in 2014, which was already a record setting number. Why China’s trade surplus matters Trade surplus matters because it influences GDP growth. In fact, one of the main components of GDP calculated using the expenditure approach is net exports. The difference between exports and imports, can be a trade surplus or trade deficit. Therefore, a large or increasing trade surplus will boost GDP growth assuming all else remains the same and can help offset weaknesses elsewhere to a certain extent. GDP growth in China is in turn one of the most closely watched metrics by many people. The reason why is simple. As the second largest economy, China is one of the most important markets for many companies around the world. Certain sectors such as commodities are especially sensitive to whatever goes on in China. (click to enlarge) For the fourth quarter of 2014, GDP growth rate came in at 7.3 percent. GDP growth rate for the whole of 2014 was 7.4 percent. The expectation was for 7.2 percent and 7.3 percent respectively. The target set by the Chinese government at the beginning of the year was for “about 7.5 percent” annual GDP growth. China shorts assume that China’s growth rate will go down However, despite GDP growth beating expectations, there are many who remain bearish when it comes to China. For instance, the International Monetary Fund (IMF) projects GDP growth to come in at 6.8 percent for 2015 and 6.3 percent the following year. There are others who are even more bearish. With so much negative sentiment around, it’s no wonder that some may be tempted to short China. The thinking is that a slowing economy will have a negative impact on company earnings, which in turn should affect their valuation. Shorting makes sense in such a situation. However, since there is no one who can accurately predict the future, it’s not possible to say for certain what will happen in the future. It may or may not be true. In other words, expectations that China’s growth rate will continue to go down may be misplaced. (click to enlarge) China shorts will point out that the current growth rate is much less than the double digit growth in previous years. However, contrary to what is often reported, double digit growth in China is actually the exception and not the norm. GDP growth rate does not move in a straight line, but goes up and down along the way. There are many factors that can throw projections off course Record trade surpluses are just one factor that can result in China’s growth rate coming in above expectations. For instance, the IMF originally expected China’s GDP growth for 2014 to come in at 7.2 percent early in the year. They later raised this to match the official government target. In other words, the projections for 2015 could be adjusted upwards in the coming months just like the IMF did the previous year. Furthermore, the Chinese government is a wild card as it has several options available to influence GDP growth. For instance, the one year benchmark lending rate is at 5.6 percent, which is quite high in an era where low interest rates are common. Besides interest rates, reserve requirements for banks is at 20 percent. China also has fiscal reserves that could be used. Depending on what target the Chinese government sets for 2015, it may deploy some or all of the available options. All of which can throw projections way off course, which would have negative implications for shorts that are banking on projections coming true. Shorting China based on GDP growth expectations is therefore highly risky and not recommended.

Best High-Yield Bond Funds For 2015 – Part 3

Summary HYD has a higher yield and lower credit quality. HYMB has higher credit quality and better total return history. HYMB has large exposure to California. In part one , we compared the two largest high-yield bond funds: iShares iBoxx $ High Yield Corporate Bond (NYSEARCA: HYG ) and SPDR Barclays Capital High Yield Bond (NYSEARCA: JNK ). In part two , we compared two short-term high-yield bond funds: PIMCO 0-5 Year High Yield Corporate Bond (NYSEARCA: HYS ) and SPDR Barclays Short Term High Yield Bond (NYSEARCA: SJNK ). In part three, we will look at the offerings in the high-yield municipal bond space: SPDR Nuveen S&P High Yield Municipal Bond (NYSEARCA: HYMB ), Market Vectors High-Yield Municipal Index (NYSEARCA: HYD ) and the much newer Market Vectors Short High-Yield Municipal Index (NYSEARCA: SHYD ). Index & Strategy HYD tracks the Barclays Municipal Custom High Yield Composite Index while HYMB tracks the S&P Municipal Yield Index. HYD was created in February 2009, HYMB in April 2011. These two funds have a correlation of 0.9836. On the expense ratio, HYMB has an asterisk because it is currently subsidized through October 31, 2015. Without the subsidy, the expense ratio would be 0.50 percent (the yield would also dip 0.05 percent). On volume, HYD’s price is half that of HYMB, so dollar volume is about three times higher for HYD. HYD has a higher yield, lower expenses and longer average duration. As we’ve seen when comparing other high-yield ETFs, total returns have favored the funds with shorter durations, lower yields and higher credit quality. As for the latter, HYD has 30 percent of assets in BBB rated debt; 22 percent in BB; and 17 percent in B. HYMB has superior credit quality, with 21 percent of assets in A rated debt; 22 percent in Baa; and 33 percent below Baa. Both portfolios have about one-quarter of assets in unrated debt. Both funds give a geographic breakdown of their assets as well. HYMB has 14.2 percent of assets in California, while HYD has only 8.9 percent in the state. HYMB’s next largest state is Texas, with 7.5 percent of assets, while HYD’s second largest holding is NY with 8.5 percent of assets. One other option out there is Market Vectors Short High-Yield Municipal Index. The fund tracks the Barclays Municipal High Yield Short Duration Index. It has an expense ratio of 0.35 percent and a yield of 3.10 percent. It has a duration of 4.17 years. The fund is overweight Texas, at 10.5 percent of assets. Credit quality is 48 percent in BBB rated debt; 16 percent in BB; 10 percent in B; and 2 percent in CCC. It has higher credit quality than HYD. The fund has only $80 million in assets and trades about 20,000 shares per day. SHYD had only one year of history, with an inception date in January 2014. Performance The price ratio chart of HYD and HYMB shows HYD in a persistent downtrend, signifying under performance. However, there are two clear periods when HYD outperformed: summer 2011 and summer 2013, while under performing in July 2014. (click to enlarge) Summer 2011 was a period when investors worried about sovereign debt in the U.S. and Europe, getting to the point where people were discussing a U.S. Treasury default. In summer 2013, Detroit declared bankruptcy , while in summer 2014, Puerto Rican bonds sold off sharply. This shows that the portfolios have deviated substantially when volatility increases. A performance chart shows that only the Detroit bankruptcy led to significant price declines. (click to enlarge) Income HYMB has a 30-day SEC yield of 3.83 percent versus HYD’s 4.31 percent yield. As has been the case with other high-yield funds, falling interest rates have weighed on the fund’s payouts. (click to enlarge) Risk & Reward Compared to the Barclays Municipal Index, HYD has a beta of 1.50 and HYMB has a beta of 1.61. Investors are taking on more market risk with these funds as compared to aggregate muni bond funds and the beta reflects this. The Barclays Municipal Index has a standard deviation of 3.72. HYD has a standard deviation of 6.24 and HYMB a standard deviation of 6.42. These standard deviations are higher than any of the junk bonds previously covered in parts one and two. This is due to the volatility surrounding Detroit’s bankruptcy in 2013. High-yield corporate bonds have enjoyed a smoother ride over the past three years and this is reflected in their lower standard deviation. Bloomberg’s ranking of states by their underfunded pensions shows a wide gap between the states when it comes to financial management. Between HYD and HYMB, the one state that sticks out is California. While most state exposure is similar, California accounts for 5 percentage points more of HYMB’s assets. Investors with a strong opinion on California’s long-term finances can opt for one fund over the other, but for other states, single state exposure is not as large a concern. Conclusion Municipal debt is not out of the woods because unfunded liabilities will eventually become a public debt if the municipality doesn’t go bust first. In the long-run, that favors HYMB’s superior credit quality-assuming California isn’t one of the problem states in the future. As for 2015, municipal bonds appear to be in good shape. Investor interest in municipal bonds recovered in 2014 after a drop in 2013. The Federal Reserve Z1 report shows municipal debt was $2.999 trillion in 2009, and as of Q3 2014, that number fell to $2.908 trillion. State and local governments have been slowly repaying their debt, leaving many states in a stronger financial position than they were six years ago. Liabilities such as unfunded pensions are a concern in states that haven’t addressed the problem, but overall the supply of muni debt has stayed constant as the economy has grown. While the municipal bond market looks attractive next to corporate junk bonds in terms of risk/reward, PIMCO 0-5 Year High Yield Corporate Bond (covered in part two) appears more attractive for 2015 given it has declined since the summer along with high-yield corporate bonds. If the economy stays strong in 2015, HYS is likely to recover and deliver some capital appreciation. It lacks energy exposure, which could struggle if the U.S. dollar continues its rally in 2015, and that could help it beat other high-yield bonds funds this year.

RWE – Recovery Postponed, Indefinitely?

RWE has warned earnings will not as expected bottom out in 2015. It will also struggle with its debt target. The announced strategic moves are not enough short term relief. Political risk is high with major pieces of legislation in a controversial debate, namely capacity markets and climate legislation. RWE is the most exposed within the peer group. As power markets in Europe get taken over by new structures, volatility and earnings risk, energy system infrastructure is a better investment proposition. RWE’s ( OTCPK:RWEOY ) earnings warning weighs stronger short term than its strategic moves. The company will continue to struggle with weak commodities and high leverage in 2015, despite the DEA sale. It may embark onto some rescuing of value through power plant sales, but it does not have the potential to deliver a similar strategic boost to E.ON. RWE is at the heat of the political storm that still has high potential to deliver more unpleasant surprises. Infrastructure and the private sector, conversely, might be beneficiaries. There are signs that private investors with longer strategic horizon are circling around distressed assets. They will gain a more important part in a decentralized energy market. Asset rotation will be a feature. My view of increasing M&A activity remains underpinned. RWE is not out of the woods yet; investors who were hoping for earnings stabilization as indicated by the company in April 2014 may be disappointed. Management has warned on earnings , saying that the earnings trough may not occur in 2015 yet. Consensus has not bottomed out for 2015 yet and it may still come down. Power prices are the unsurprising cause of the problem. Futures are pointing nowhere to a meaningful enough recovery, and the broader commodities environment is not any more supportive. RWE more than any of its peers, needs significant commodity recovery. In tandem with the above comes relentless balance sheet stress. I find little chance of material decrease of leverage. The Urenco sale will not come through short term. The CEO has further confirmed that leverage falling to 3x net debt/Ebitda by 2016 will be “extremely difficult to achieve”. I estimate just short of 4x for 2016. Attention will swiftly return to risk to the dividend. RWE may rescue some value through selling its power stations that are unprofitable abroad as announced this week. That is clearly a strategy to mitigate cash losses. It would bring minor debt reduction. Some of the company’s plant is new and competitive technology. The bulk of the RWE’s mothballing and closure programme is less than 20 years old, some plants are not even three years from commissioning. That concerns particularly gas. It is sensible that management looks to maximise value of otherwise potentially stranded assets. But, a power plant cannot be displaced and sold into another location like other capital assets. High quality and well performing equipment may still find a market value in locations with tighter reserve margins and new build demand. The CEE region comes to mind. There is also an active secondary plant market also in Asia. There will clearly be a loss of value for RWE. Investors should not hold up high hopes of significant earnings contributions from the process. Signaling power to the political powers may be stronger than actual earnings impact. Infrastructure investors have begun to look at power generation with a view of power price recovery over the long term. The prospect for capacity payments may underpin that kind of activity. Germany is uncertain on that note, but plenty of European countries putting into place capacity markets could keep M&A activity up. All of RWE’s strategic moves could in the end amount to a similar outcome to E.ON’s corporate split. The company has been vocal about reducing the share of generation to 5% of earnings. Most recently, the CFO has now said it no longer rules out a similar move even though management decided against it in 2012. RWE is in a different situation to E.ON ( OTCQX:EONGY ), in that it cannot bring as diversified a generation park into any potential new co. Merging renewables into a “genco” may remedy to a point. But in that case management would have to have a clear strategy about how it would pursue downstream brand equity and service/product packing for which renewables exposure is important. A split co will also not have the same upstream and oil and gas diversification as E.ON. That would make a genco or “upstreamco” resemble much more of a bad bank than in the case of E.ON. Importantly, it would in my view have to raise capital in order to fund the nuclear liabilities that the genco would inherit. RWE might embark onto greater strategic change beyond its already announced transformational steps. That would be a positive. But with the chances increasing that more steps are taken, so does the probability of a capital increase. I see significant potential for large parts of RWE’s business going private. Meanwhile, the debate over capacity payments rages on. The Economy Minister’s has again repeated he is opposed to capacity payments , which is out of line with market expectations. The political debate bears high potential for disappointment. My preferred exposure in all of this is infrastructure, engineering and market backbone. Editor’s Note: This article discusses one or more securities that do not trade on a major exchange. Please be aware of the risks associated with these stocks.