Tag Archives: nysearcafxi

India Small-Cap ETFs: Best Of Emerging Markets Now?

After witnessing two months of lull, the Indian stock market finally belied cynics in July as it easily combated global issues like the bursting of the Chinese stock market bubble, nagging Greek debt deal negotiations, looming Fed rate hike and the strength in the greenback. Investors also rushed to capitalize on this grit and poured Rs. 5,300 crore (net) in Indian equities last month. Reduced worries over monsoon deficiency, a timely correction in the stock market and rising domestic investment led the key Indian bourse to bounce back from late June. Earlier, investors were unnerved by apprehensions of lower rains this monsoon which would take a toll on the all-important agricultural sector and push up inflation. The fear was not baseless either as RBI cut India’s growth forecast for fiscal 2015-16 from 7.8% to 7.6%. However, contrary to this apprehension, rain deficiency has not been as severe as predicted. The Indian market surged over 30% last year. While most of the gains were wiped out this year on Fed rate hike concerns and a spate of downbeat economic indicators including weak corporate earnings and political gridlock causing hindrance in intended reforms, the correction opened the door to further expansion. This was truer given the extremely muted levels of energy and gold prices. This was because India imports more than 75% of its oil requirements and accounts for about 25% of the global gold demand. This makes the country highly susceptible to these commodities’ prices. India’s foreign-exchange reserves are close to a staggering $355 billion, which gives the economy the power to fight the expected volatility post Fed tightening, per Bloomberg . Unlike taper tantrums in 2013, Indian rupee remains largely stable and shed only 0.6% in the last one month (as of August 5, 2015) relative to the U.S. dollar. In fact, the uproar in global markets, mainly in Greece and China, brightened India’s appeal as a safer bet in the high-risk emerging market (EM) pack. The economy expanded 7.3% in 2014-15 versus 6.9% in 2013-14, indicating that the Indian economy is taking root. Of course, it has its set of issues like political gridlock, inflation woes, and a still-muted investment backdrop, but the economy appears much more stable than other emerging markets. A Look at Other Emerging Giants At this point of time, India scores higher than its other EM cousins like China, Brazil, Russia and South Africa. Chinese stocks are now infamous for extreme volatility having experienced recurrent market crashes since June. The country’s economy has also been displaying offhand economic data for long, leaving expectations for further monetary easing as the only hope in the China Investing theme. Popular Chinese equity ETF FXI was 7.8% down in the last one month. Coming to Brazil , the condition is more worrisome. As much as a 7.4% fall in the Brazilian real in the last one month (as of August 5, 2015) against the U.S. dollar, a commodity market slump, spiraling inflation and raise in rates (presently as high as 14.25% , almost double that of India’s) have crippled the Brazilian economy. Analysts have raised the 2015 inflation outlook for Brazil from 9.23% to 9.25% while its GDP is expected to shrink by 1.8% from the prior forecast of 1.76% contraction. The largest Brazilian ETF EWZ was down about 13% in the last one month. Russia is yet another emerging market which turned a bear from once-a-bull country. An unbelievably prolonged and steep fall in oil prices, Western bans and an 11.7% one-month slide in the Russian currency clearly explain the pains for this oil-rich nation. The IMF now expects the Russian economy to skid into ” deep recession ” (down 3.4%) in 2015. The most popular Russian ETF RSX lost 4.7% in the last one month. The Indonesian currency was almost resilient to dollar gains but weak corporate earnings and a spate of soft economic data weighed heavily on investors’ sentiments. Dollar gained just 1.2% in the last one month against Indonesian Rupiah. The World Bank also slashed its projection for Indonesia’s 2015 economic growth from 5.2% to 4.7%. Indonesia ETF EIDO was off 3% in the last one month. South Africa’s currency shed about 3.3% in strength in the last one month (as of August 5, 2015) and growth prospects remain bleak. This is also a commodity-rich nation and will likely the bear the brunt of the commodity market crash. South African ETF EZA retreated 2.2% in the last one month. Turkish lira also slipped 3.3% last month (as of August 5, 2015). Along with this, political upheaval and still-subdued growth in the EM pack led the Turkey ETF TUR to shed about 9% in the past 30 days. Reasons to Cheer for Indian Small Caps Since small caps better reflect an economy’s strength and are largely unruffled by global shocks, Indian small caps should be the best-positioned EM options right now. Investors are advised to take a peek into our top-ranked ETFs, India Small Cap ETF (NYSEARCA: SCIN ), India Small-Cap Index ETF (NYSEARCA: SCIF ) and iShares MSCI India Small Cap Index Fund (BATS: SMIN ). Each carries a Zacks ETF Rank #2 (Buy). SCIN, SCIF and SMIN added 9.2%, 9.7% and 6.8%, respectively, in the last one-month period while in the past one-week frame, the trio advanced 5.5%, 4.7% and 4.8% (as of August 5, 2015). Original Post
Buy On Euphoria, Sell On Panic – A Contrarian Strategy That Works For China

A newly-published risk model shows that buying on euphoria and selling on panic has been a successful strategy for Chinese equity markets. Rational investment Chinese style is to watch for shifts in government policy rather than changes in spreadsheet data. Liquidity is seen as the proxy signal for when Beijing turns positive/negative on equities and roll out measures to support or suppress higher prices. It shouldn’t work – but it does. Winners in China’s A-share markets buy when market sentiment is high and sell when market sentiment is low. Or, as I recommended to investors in a previous post, toss out the spreadsheet and other textbook fundamentals and go with herd psychology. It works. And now there is a study to prove it. Credit Suisse has just published a risk model for investing in Chinese stocks. And it has found that the signals for buying and selling in Chinese markets are “the opposite” of what’s expected everywhere else in the world. Chinese investors buy on euphoria and sell on panic – and the strategy has been successful on the whole, according to the Swiss banking group which has now included China in its proprietary Global Risk Appetite Index. The index, which has been around for some 20 years, measures the performance of stock markets against government bond markets based on rolling six and 12 month returns and correlates risk appetite with investment signals. The global version shows that risk is cyclical and confirms accepted market wisdom that the best time to buy is when risk appetite is low (such as during a panic) and to sell when risk appetite is high (as when the market is in euphoria). The cycles in risk appetite in most markets correlate closely with what is happening in the global economy. Extremes in risk appetite thus provide reliable countercyclical trading signals. So if you buy when the market panics and wait for the eventual rebound, you make a tidy profit. China, as always, is different. Prices don’t follow fundamentals in the way they do elsewhere in the world but are more closely linked to investor psychology, according to the report. Among the findings , as reported by the media, are: “… in China, buying the market when risk appetite was high and selling when risk appetite was low has been a successful strategy in general. This is the opposite of how our Global Risk Appetite Index has behaved.” The report gave two reasons for why the China market is different. One, the free float is much smaller than in other markets because state firms account for 45% of market valuations. Small moves in a stock can thus have a huge impact on the price. Second, the level of government intervention is high. Further distorting traditional signals is the extreme swings in risk appetite that characterize the Chinese market. Prices tend to overshoot and go off the charts before reverting to the norm – challenging standard concepts of “cheap” valuations. Nor are conventional performance metrics of much help. The fortunes of individual companies can – and have been – scuppured by government campaigns, such as Beijing’s anti-corruption drive. The Chinese corporate world is unusual in that the sins of executives are often visited on the companies they run. When a top executive falls, he typically brings down all around him, sometimes even the company itself, as I explained in a previous article, ” The Midnight Knock. ” The strategy that has produced results in China’s contrarian equity markets is to follow the herd. This means jumping in when the market is high (as the chances are that you can sell even higher) and dumping stocks when the market is low (as it is likely to go even lower). But this does not mean the Chinese stock market “behaves weirdly”. Investors in China simply follow a different set of rules, as I have argued in many previous posts. They track fundamentals but of a different sort. Chinese fundamentals have little to do with western textbook metrics and everything to do with government policy – unlike in Western markets where the term “fundamentals” has been hijacked by the financial industry to mean only spreadsheet data. In China, the very visible hand of government is always hovering – skewing market direction and distorting what would be classic signals in the free and open markets of advanced economies. The valuation that matters in China is the price-to-fear/greed ratio. And the signal for the switch from greed to fear and back is liquidity. Driving stock prices in China is liquidity . Not the economy. Not corporate earnings. Not abstract theories of reform or quality growth that is supposedly superior and sustainable for years to come. Liquidity is seen by Chinese investors as the proxy signal for when the government turns positive/negative on equity markets and will roll out measures to support/suppress higher prices. The biggest losses since the rally took off in earnest last September have all been triggered by market fears that the regulator was about to put an end to the party by pulling liquidity. Investors started turning skittish in January when the regulator tightened rules for entrusted loans which had been providing funds for stock purchases. The move was perceived as signaling a coming government squeeze on liquidity to cool the bull run in equities. The market has since been swinging between greed and fear amid conflicting interpretations of Beijing’s policy moves. Every investor in Shanghai and the rest of the country has been watching every other investor to see who might be pulling out and who might be doubling down on their bets. Confidence is a fragile commodity in a market where policy U-turns can happen overnight and with little warning. Hence, the inherent volatility in A-share prices. China’s domestic investors did not put money into the market because the textbook fundamentals looked right. On the contrary, price-to-earnings ratios were soaring, the yield advantage that stocks offer over bonds rapidly shrinking, and economic growth was at a 24-year low with corporates sagging under heavy debt burdens. What domestic punters had been betting on for the past year was a liquidity story backed by policy – the only fundamental that matters in China. The A-share markets are likely to remain range-bound in the coming weeks as investors digest the implications of Beijing’s stock rescue and decide if there is time for one more roll of the dice. This is rational investment, Chinese style. Disclosure: I/we have no positions in any stocks mentioned, and no plans to initiate any positions within the next 72 hours. (More…) I wrote this article myself, and it expresses my own opinions. I am not receiving compensation for it (other than from Seeking Alpha). I have no business relationship with any company whose stock is mentioned in this article.

There Is A Bubble In China; What Does It Mean For FXI Investors?

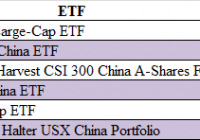
Summary There is a stock market bubble growing in China. Although the share markets in mainland China have grown furiously, the Hong Kong share market has lagged significantly. The iShares China Large-Cap ETF share price hasn’t been affected by the mainland bubble too much as it invests in Hong Kong listed shares. If the current bubble is similar to the 2006/2007 one, FXI should start to grow rapidly in the coming months, with a 50-100% upside potential. If the current bubble turns out to be different and it starts to collapse soon, FXI has only a limited downside of 20-25%. As I wrote in my article last week, there is a bubble underway in China. The Chinese share market has experienced incredible growth in the last 12 months. The main Chinese share indices are up by more than 130%. As I stated earlier, if the current bubble turns out to be similar to the 2006/2007 Chinese share market bubble, it should start to burst sometime in November. In this article, I focus on the performance and perspectives of the iShares China Large-Cap ETF (NYSEARCA: FXI ) – the largest China focused ETF. China focused ETFs There are many ETFs that invest in Chinese shares, but only 6 of them have asset value of over $200 million (table below). By far the biggest is the iShares China Large-Cap ETF with assets of over $7.7 billion, followed by iShares MSCI China ETF (NYSEARCA: MCHI ) ($2.38 billion). Source: ETFdb.com The chart below shows that there are huge differences between performances of these ETFs. 5 of the 6 biggest China focused ETFs grew only by 20-30% over the last 12 months. On the other hand, share price of the db X-Trackers Harvest CSI 300 China A-Shares Fund (NYSEARCA: ASHR ) grew by 133%. The reason is simple. While ASHR invests in A-Shares traded in Chinese mainland, the other ETFs invest in shares of Chinese companies traded in Hong Kong. As we can see, there is a huge difference between the growth of Chinese mainland share markets and the Hong Kong share market (chart below). While Chinese A-shares and B-shares are up by 138% and 125%, respectively, the Hang Seng indices are up only by 15-30%. The Chinese bubble and FXI As shown in the chart below, FXI’s share price is much more related to the Hang Seng China Enterprises Index than to the Shanghai Composite Index. Although FXI experienced huge losses during the collapse of the 2006/2007 bubble, it is important to notice that there was a bubble in Hong Kong as well as in mainland China back then. Today, we can hardly talk about a bubble in Hong Kong as the gap between share valuations in Shanghai and in Hong Kong is huge. FXI recorded its biggest gains during the last growth phase back in 2007. If history should repeat itself, FXI’s share price must start to grow rapidly before it collapses. If the Chinese mainland share bubble starts to burst right now, FXI’s share price will be impacted, but the decline will be only limited. It won’t be comparable to the 2008 one. The table below shows the 15 biggest holdings of FXI. 10 out of the 15 companies are dual listed in Chinese mainland and in Hong Kong. The table shows actual share prices in mainland (in CNY), actual share prices in Hong Kong (in HKD) and Hong Kong share prices converted to CNY using the current exchange rate of HKD/CNY = 0.801016. As the calculations show, 9 out of the 10 dual-listed companies are cheaper in Hong Kong than in mainland China. Only the shares of Ping An Insurance Group (OTCPK: PIAIF ) (OTCPK: PNGAY ) are more expensive in Hong Kong. Some of the differences are really huge. For example, shares of China Life Insurance (NYSE: LFC ) (OTCPK: CILJF ) are 21% cheaper, shares of Bank of China (OTCPK: BACHF ) (OTCPK: BACHY ) are 16% cheaper and shares of PetroChina (NYSE: PTR ) (OTCPK: PCCYF ) are 4% cheaper in Hong Kong than in mainland China. (click to enlarge) Source: own processing, using data of ishares.com and Bloomberg Conclusion Although there is a share market bubble in mainland China, the Hong Kong share market hasn’t inflated yet. The shares of most of the dual-listed companies are much cheaper in Hong Kong than in mainland China. There are only two ways how the valuation gap may be eliminated. The Hong Kong share price must grow or the Chinese mainland share prices must decline (or a combination of both). The first option is favorable for FXI shareholders and the second one is relatively neutral for them. There is a bubble on the Chinese share market, but Hong Kong has been impacted only slightly. FXI shareholders don’t have to fear a bubble burst right now. If the Chinese bubble starts to collapse, FXI shares should experience only a limited impact. During the 2006-2007 bubble, the Hong Kong share market lagged behind the mainland market significantly, only to start to grow furiously during the last phase of the mainland bubble. If history repeats itself, FXI has 50-100% upside potential. If the history doesn’t repeat itself and the mainland share market starts to collapse before the Hong Kong share market inflates, there is only a limited downside of 20-25%. Disclosure: I/we have no positions in any stocks mentioned, but may initiate a long position in FXI over the next 72 hours. (More…) I wrote this article myself, and it expresses my own opinions. I am not receiving compensation for it (other than from Seeking Alpha). I have no business relationship with any company whose stock is mentioned in this article.