Relative Value The Reason To Keep Buying Munis And Long Bond ETFs

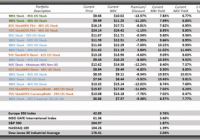
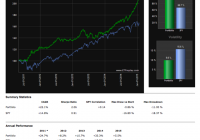
Two-and-a-half years back, the U.S. Federal Reserve, placed that percentage at 2%. Yet the U.S. has failed to hit the bulls-eye. In spite of the media hype that surrounds the notion of imminent Fed rate hikes, history suggests that the Fed will need to remain exceedingly “patient.” As much as the Fed might like to get us all off the drug of ultra-low borrowing costs, there are other risks with raising rates too soon. Since the Reserve Bank of New Zealand first formerly targeted inflation rates roughly 25 years ago, other central banks around the globe have followed suit; that is, many banks have been setting medium-term rates that prices should rise on an annualized basis, and then presenting those percentages publicly. Two-and-a-half years back, the U.S. Federal Reserve, placed that percentage at 2%. Yet the U.S. has failed to hit the bulls-eye. Trillions in electronically created dollars over 30 some-odd months, coupled with zero percent overnight lending rates during the Fed’s inflation targeting period, and the U.S. is still a long way from the stated goal. In spite of the media hype that surrounds the notion of imminent Fed rate hikes, history suggests that the Fed will need to remain exceedingly “patient.” In the quarter century of inflation targeting (at least as far as I have been able to determine), the Fed has never kicked off a rate tightening period when inflation sat below 2%. In truth, the Fed is not oblivious to the fact that dogged determination to move towards the normalization of overnight lending rates is more likely to hinder economic progress than ensure price stability or advance employment objectives. Who but a few members of Congress will grumble at Janet Yellen’s Fed deciding to push back into Q3 or Q4? After all, haven’t we already lived with zero percent rate policy (ZIRP) for six-plus years? As much as the Fed might like to get us all off the drug of ultra-low borrowing costs, there are other risks with raising rates too soon. With both Japan and Europe injecting trillions of QE dollars in an effort to boost inflation and improve economic prospects abroad, the money inevitably finds its way into market-based securities of relative value. The German 10-year? 0.35%. Spain? 1.3%. What overseas institution or money manager would not look at those 10-year yields and consider the safety of U.S. 10-year treasury bonds at 1.8% instead? Or our ultimate safe haven prospect, the 30-year at 2.37%. Granted, those are obscenely low yields that barely compensate for historical cost of living. On the other side of the ledger, though, the U.S. bond market has plenty of room to run on price before comparable yields match those of overseas sovereign debt securities. Yet these facts epitomize the Fed’s dilemma. The 30-Year (TYX):10-Year (TNX) spread has moved from 0.90 one year earlier to 0.57 today; the spread between the 10-Year and the 2-Year has shifted from 2.43 to 1.28. The yield curve continues to compress, and may get close to partial inversion if the Fed fails to exercise patience. Inverted yield curve? Partial inversion? What’s the big deal? Well, you’re talking about a circumstance where the odds of a domestic recession increase dramatically. Inverted yield curves have a near-perfect record of forecasting recessions in the U.S. For that matter, raising local rates before determining whether Europe, Japan and the rest of the world are capable of escaping respective recessions and stagnation is akin to suggesting the U.S. is self-sustaining island. Decoupling theories notwithstanding, the well-being of the United States is still very much dependent on what happens on the world stage -from China to Russia to Germany to Saudi Arabia. The investing implications may be as simple as supply and demand. Wouldn’t intermediate and long-term rates naturally go higher if demand for government bonds were waning? Similarly, with prominent proxies like the German 2-year heading further and further into negative returns, why on earth would foreign institutions and/or wealthy foreigners stop buying U.S. debt? The Vanguard Long-Term Bond ETF (NYSEARCA: BLV ) is still a winner when it comes to the probability of price gains. Meanwhile, if you’re looking to ensure higher monthly distributions, munis still offer relative value. The SPDR Nuveen Barclays Municipal Bond ETF (NYSEARCA: TFI ) works, and for those who welcome a little leverage and are not afraid of some volatility in the space, consider closed-end muni bond funds like the Nuveen Municipal Opportunity Fund (NYSE: NIO ) or the Eaton Vance National Municipal Opportunities Trust (NYSE: EOT ). As much as U.S. investors would like to believe in the miraculous, never-say-die, resilience of the U.S. economy, the facts about our “low” unemployment rate and our “accelerating” gross domestic product (GDP) are entirely misleading. Only 46% of 16-54 year olds are working; it was closer to 52% at the eve of the Great Recession in December 2007. Tens of millions of retirees in the early 50s? Not bloody likely. And what about the acceleration of GDP in the last few quarters? It is primarily due to an undesirable increase in household debt. Here is a brief history lesson. Americans held $6.3 trillion in household debt in June of 2002. Due to the housing bubble in which anyone could borrow any amount to get rich quick, that number swelled to $12.6 trillion by June of 2008. The Great Recession required that consumers had to deleverage, refinance or default, but total household debt only dropped to $11.3 trillion by December 2012. Perhaps ironically, the reamarkble stock gains that occurred in 2013 and 2014 are partially attributable to household debt climbing back up once more, up to $11.7 trillion at the latest figures of September 2014. Some argue that this proves that U.S. consumers have been happily consuming. Well, yes… on borrowed dollars. After all, real wages have been declining and are actually lower than they were in December of 2007. Isn’t it true that the lower interest rates make the cost of servicing $11.7 trillion in September 2014 much more sustainable than the cost to service debt back in June 2008? Absolutely. Unfortunately, this notion of debt servicing costs being the only important factor means interest rates need to stay permanently lower for U.S. consumers to borrow-n-spend. If rates go higher, the only way that picture does not get ugly is if Americans start earning a whole lot more from their employers. In other words, either rates have to stay exceptionally low for households and the U.S. government to service the monstrous debts, or households and the U.S. government need to earn a whole lot more than they’ve been earning. Which scenario do you see as most probable – employers paying workers higher real wages in the months and years ahead, or the Federal Reserve barely touching the overnight lending rate? In 15 years, the Bank of Japan (BOJ) has not been able to get their overnight lending rate above 0.5%. When you combine the reality of low rate addiction/necessity with limited supply/extraordinary demand for longer-term sovereign debt, you conclude that yields will keep falling. Investment possibilities should include: BLV, TFI, NIO, EOT, as well as the Market Vectors Long Municipal Index ETF (NYSEARCA: MLN ) and the SPDR Nuveen S&P High Yield Municipal Bond ETF (NYSEARCA: HYMB ). Disclosure: Gary Gordon, MS, CFP is the president of Pacific Park Financial, Inc., a Registered Investment Adviser with the SEC. Gary Gordon, Pacific Park Financial, Inc, and/or its clients may hold positions in the ETFs, mutual funds, and/or any investment asset mentioned above. The commentary does not constitute individualized investment advice. The opinions offered herein are not personalized recommendations to buy, sell or hold securities. At times, issuers of exchange-traded products compensate Pacific Park Financial, Inc. or its subsidiaries for advertising at the ETF Expert web site. ETF Expert content is created independently of any advertising relationships.