Tag Archives: load

Cotton Continues Its Bounce Along The Bottom

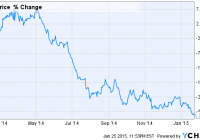
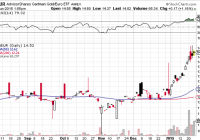
Summary Prices over the last several months have trended lower. Petroleum prices will continue to put downward pressure on cotton. The 2015 U.S. planting season begins in mid-March. Introduction During my last article, the 2015 outlook for cotton , I remained somewhat optimistic that this commodity would find a bottom. Even given that assessment, I recommend that you avoid iPath Dow Jones-UBS Cotton Total Return Sub-Index ETN (NYSEARCA: BAL ). That assessment has again proven to be correct. Let’s take a look at the past years performance: Article Date Recommendation Closing price for BAL 7/18/2014 Avoid 45.65 9/26/2014 Avoid 41.35 Table created by Nathan Buehler As of market close on 1/23/2015, BAL is trading at $39.02 per share. 2015 planting season My outlook last year was that U.S. farmers would choose other, more profitable crops to plant, instead of cotton. This, so long as the downward trend in prices continued. The downward trend has continued and we are now nearing 2015 planting decisions. Below is a good read supporting my position: Agweb.com: 2015 Outlook: Get Ready for a Cotton Crop Swap? Other recent developments, such as the drop in corn prices due to lower oil, have me revisiting this topic. Many other agricultural commodities, not just cotton, have come under pressure recently due to the drop in oil. See the upcoming events below for more insight. Upcoming events Several events in February bear watching. The National Cotton Council will release results of U.S. cotton producers’ survey on February 7th. Per their website, they are expecting a decline in acreage for the 2015/2016 planting season. On February 20th, the USDA will release preliminary estimates on everything from trade to production of cotton. You can view their currently released data here . These events are very important. Both will shed light on what farmers are thinking for 2015. If other crops are seeing the same margin pressures as cotton, we could see farmers hold the line. Even with this sector’s pressures, I see a significant decline in acreage for cotton in the U.S. Supply (click to enlarge) Chart retrieved from Cotton Inc. on 1/26/15 Supply continues to run higher than demand adding to global stocks. Global stocks-to-use are at all-time highs thanks to China’s reserve policies. During the past articles we discussed how technological advances in India have pushed their yield per acre up significantly over the past decade. India is now poised to overtake China as the number one cotton producer in 2015. Will India reduce acreage in 2015? Analysts are saying yes. China continues to have significant stocks and is sticking to its import quota to promote domestic demand. Current reports show that Chinese farmers are predicted to plant 15% less acreage of cotton in 2015. The Delta Farm Press is reporting that globally, acreage could decline about 10%. I recommend a read of their article here . It highlights many global points on production, including the water situation in Australia. Demand On the other side of the coin, demand for cotton has remained relatively steady. (click to enlarge) Chart retrieved from Cotton.org and based on estimates from the World Agricultural Outlook Board of USDA. 1/26/2015 Global economic news over the past several months has not been positive. China has continued to post lower than expected growth. Europe has announced several additional stimulus measures to prop up regional growth. The IMF has revised global growth down to 3.5%. None of these developments are a buy signal for cotton and put further downward pressures on its price. China could be experiencing problems with its reserves. Several mills have reported quality problems. I encourage you to read this article which goes into greater detail on the situation. Should this develop into a larger problem, it could cause a short-term spike in prices. Oil/Polyester Oil is a direct competitor of cotton through polyester. Polyester prices have followed the decline in oil, though not as drastically. Cotton prices have remained depressed and I don’t see the drop in oil as being a huge negative for cotton. If anything, consumers could see more disposable income which could boost demand for cotton products. Chart retrieved from: link I found the below chart interesting and wanted to share: Conclusion To prevent redundancy, as your time is valuable, I have tried to include many links to good reads in this article. February will be a foundational month for cotton futures. Are we going to put a floor or ceiling on prices? After analyzing the supply and demand data, preliminary production outlook, and the possible quality problems in China, I see cotton putting in a floor in February. I am changing my avoid rating of BAL to neutral. I personally believe better opportunities exist in the market right now outside of cotton. For the remainder of 2015, I am looking for oil to be the best performing commodity. This is always dependent on the economic outlook and the stimulus measures in Europe taking hold. I sincerely thank you for reading and I hope this article helps you in your investing decisions.

Gold-In-Euro-Terms ETF Capitalizes On ECB’s QE Plan

Summary Gold is falling after ECB’s bond purchasing plan. Stronger USD is weighing on gold. However, bullion investors can use a euro-denominated gold ETF to hedge the depreciating value of the EUR. Gold exchange traded funds rose on a knee-jerk reaction Thursday, following the European Central Bank’s aggressive bond-purchasing plan, as traders anticipated a rise in inflation. However, investors soon realized that the ECB actions would benefit the dollar or weigh on USD-denominated bullion. The SPDR Gold Trust ETF (NYSEArca: GLD ) has increased 10.3% year-to-date but was down 0.9% Friday and again Monday. Gold strengthened Thursday after traders assumed the ECB’s quantitative easing would flood the market with cash and induce inflationary pressures, but many soon realized that the money created were euros and not dollars. Since the ECB’s announcement, the euro continued to depreciate toward an 11-year low against the U.S. dollar. Consequently, the stronger USD should hurt gold as it becomes costlier for foreign traders to acquire USD-denominated assets. “What you saw was uncertainty about what the ECB was going to do-I think that’s what lifted gold higher. But I think now that this is all going to kind of settle down,” Anthony Grisanti of GRZ Energy, said on CNBC . “I don’t understand why you would think something that would strengthen our dollar would strengthen gold at this point.” Alternatively, gold ETF traders can take a look at the AdvisorShares Gartman Gold/Euro ETF (NYSEArca: GEUR ) , an actively managed ETF tracking gold in euro terms. While GLD dipped Friday, GEUR gained 1.2%. “Holding gold in a non-U.S. dollar denominated currency may help to limit the downside risk during stressed market environments where the U.S. dollar becomes a safe haven store of value,” according to AdvisorShares . Some gold investors quickly picked up on the GEUR trade as well, with the Gold/Euro ETF trading volume up to 65,000 late Friday, or more than 10 times its average daily volume, according to Morningstar data. Looking at the futures market, COMEX gold traded down 0.7% to $1,291.6 per ounce late Friday, whereas Euro Spot gold rose 0.5% to €1,151.1 per ounce. AdvisorShares Gartman Gold/Euro ETF (click to enlarge) Full disclosure: Tom Lydon’s clients own shares of GLD.

High Yield Dividend ETFs – A Tale Of The Tape

Summary These high-yield dividend ETFs offer greater yield than S&P 500. ETFs offer greater diversification than individual stocks. Unlike mutual funds, ETFs can be traded throughout the day. “Do you know the only thing that gives me pleasure? It’s to see my dividends coming in.” – John D. Rockefeller (as quoted by John Lewis in Cosmopolitan) Dividends are a beautiful thing. They are the portion of earnings that the board of directors decides to pay to shareholders. You can use dividends to purchase additional shares under a dividend reinvestment plan, have them deposited back into your brokerage account, or sent to you in the form of a check. While some view dividend paying companies as less risky than those who reinvest all earnings, others see dividends as an illusion, arguing that dividends are not tax efficient and pointing out that removing capital from a company could impact future profits or earnings ability. I view dividends as an amusing consequence of investing in companies that generally produce more cash than they need to fund ongoing operations. While I prefer dividend paying companies to non-payers, my bias is generally routed in the emotional side of personal finance and investing rather than some fundamental thesis that a portfolio of dividend payers is superior to the alternative. Much is said on Seeking Alpha about dividends and dividend paying stocks. But far less is said about their better diversified and arguably more fundamentally sound counterparts, dividend-oriented ETFs. I think most people like to own individual stocks rather than ETFs because it makes them feel they are somehow more connected to their investing strategy. They can read earnings releases, pore over 10-Qs and 10-Ks, lament on insider trading, and all the other things that investors like to do to feel a connection to their portfolio. In this article I will give up those dividend investing birthrights, and take a comprehensive and quantitative approach to analyzing four “high-yield” dividend ETFs to determine if the hands off approach has the merits fundamentally embedded ETF investing. Profiling the contenders (unless otherwise stated, market prices, NAV and SEC yield as of 1/23/15) : Vanguard High Dividend Yield ETF (NYSEARCA: VYM ) This ETF seeks to track the performance of the FTSE High Dividend Yield Index, which measures the investment return of common stocks of companies characterized by high dividend yield. Market price: $68.74 30-day SEC Yield: 2.93% Number of holdings: 392 iShares Core High Dividend ETF (NYSEARCA: HDV ) This ETF seeks to track the investment results of an index composed of relatively high dividend paying U.S. equities. Market price: $77.34 30-day SEC Yield: 3.45% Number of holdings: 78 Powershares High Yield Equity Dividend Achievers Portfolio ETF (NYSEARCA: PEY ) This ETF is based on the NASDAQ US Dividend Achievers 50 Index and will normally invest at least 90% of its total assets in dividend paying stocks that comprise the index. Market price: $13.51 30-day SEC Yield: 3.21% Number of holdings: 50 SPDR S&P Dividend ETF (NYSEARCA: SDY ) This ETF seeks to provide investment results that, before fees and expenses, correspond generally to the total return performance of the S&P 500 High Yield Dividend Aristocrats Index. Market price $79.32 30-day SEC Yield: 2.19% Number of holdings: 98 1) Diversification Diversification is the process of reducing non-systematic risk by investing in a variety of assets or asset classes that (hopefully) do not move up or down in value at the same time or magnitude. As the 2008 financial crisis taught us , there are certain unforeseeable events (think global recession, world wars) that no amount of diversification can protect us from. Despite this qualifier, I still prefer the perceived spreading of risk as opposed to the all-eggs-in-one-basket watched very closely mentality. a) Number of holdings While more isn’t necessarily better, too little can be not enough. In general, there are eight sectors or broad categories of businesses: Basic Materials, Services, Conglomerates, Consumer Goods, Financial, Technology, Healthcare, Industrial Goods and Utilities. Within each sector is a number of industries (Consumer Goods includes beverages and office supplies, Services includes auto dealerships and airlines). According to Yahoo, there are roughly 190 industry categories . An ETF need not be comprised of companies in every industry, since certain common economic factors are primary drivers across unrelated industries. Think general contractors and residential builders performing well during a housing boom. (click to enlarge) Winner : Vanguard’s quantity of holdings is sufficient to represent an investment in every major industry category nearly twice over. While it has a hefty stake in Apple, which is tough to call high yielding at less than 2% , it still has a broad base of companies that is almost four times larger than the runner up, SPDR. b) Sector Representation Vanguard High Dividend Yield Sector Allocation (Courtesy of Vanguard) iShares Core High Dividend Yield Sector Allocation (Courtesy of Blackrock) Powershares High Yield Equity Dividend Achievers (Courtesy of Invesco) SPDR S&P Dividend ETF Sector Allocation (Courtesy of State Street Global Advisors) Winner: Vanguard. All three other funds have at least 20% of their holdings concentrated in a single sector. Not so for Vanguard, who limits their sector exposure to 18.10%. What is interesting to note, and should be reviewed by investors based on their own personal preferences and profiles, is that even though these funds all have the same general approach, (high-yield and diversification), their composition is quite different. With the exception of Consumer Goods/Staples (which is the second largest sector for each) sector weighting is all over the map. Utilities makes up less than 10% of the Vanguard ETF, but is over 25% for Powershares. iShares has less than 1% Financials, but for SPDR, Financials make up its most significant holdings. 2) Fees Fees are important, that goes without saying. But unlike actively managed funds, with fees that average nearly .9% , ETFs as a whole are considered low-cost alternatives. But even with their general cost effectiveness compared to managed alternatives, it is still worth looking into which fees of index funds to make sure you keep as much of your hard earned money as possible. (click to enlarge) Winner: Vanguard. No surprise here. Vanguard’s low-cost approach to investing is something the company is very proud of. Honorable mention to iShares, which is within striking distance of Vanguard and three and four times cheaper than SPDR and Powershares, respectively. 3) Total return HDV Total Return Price data by YCharts Winner: Powershares. Past performance does not guarantee future results, and these ETFs are designed to primarily track an index. But at the end of the day, over the past five years, PEY has outperformed its competition from 8% to nearly 20%. 4) Liquidity The ability to get out of a great investment is just as important as the ability to get in. While ETFs are generally regarded as having higher liquidity than mutual funds (primarily because they can be traded throughout the day, rather than just at the end), there are reasons to avoid ETFs with excessively low volume. Chief among these are higher bid-ask spreads, which may result in the inability to profitably execute a short-term trade (not a real issue for long-term investors). However, one of the issues that arises from low liquidity (a deviation between price and NAV) can actually be an opportunity. If an ETF is trading slightly below its NAV, but the market is not active enough for it to quickly resume equilibrium, you can shave a few points off your basis by looking for opportune entry points. (click to enlarge) Winner: SPDR. More volume means better pricing (both in relation to NAV and narrow bid/ask spreads). Honorable mention everybody else. All of these ETFs provide adequate liquidity to be considered both investable and tradeable. 5) Price/earnings multiple Winner: Vanguard. It is trading at a discount both to its high dividend ETF peers but also to the S&P 500, NASDAQ and Dow Jones Industrial average . 6) Yield (click to enlarge) Winner: iShares. While all but SPDR best the 30-year Treasury yield, none of these ETFs beat the 6 stock semi-weekly dividend portfolio I wrote about recently. So, which high yield dividend should you own? Vanguard! The low-cost investing house has outdone itself with its Vanguard High Dividend Yield ETF. It has assembled a large, diverse group of stocks that pay above average dividends at rock-bottom fees trading at a reasonable price/earnings multiple. While yield is not the end-all be-all of investing, for those with assets that need income, a high-yield dividend ETF can be a perfect way to get diversified equity exposure without hitching your wagon to just a handful of stocks. A word of caution: Do your homework. Monitor your holdings. Just because one of these funds is right for your portfolio right now, doesn’t mean it will stay that way forever. Depending on rebalancing frequency, a large run up in price of an individually large stock or sector can result in a fund that is incompatible with your goals or risk preferences.