Tag Archives: lists

USO: Don’t Be Fooled By Minor Corrections

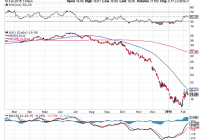
Summary After months of straight declines, oil prices seemed to bounce back starting in February. An increase in the RSI, though encouraging, is still not indicative of a broader correction. The 50-day moving average seems to be a resistance line. Oil production is still increasing. Since topping around June, oil prices have been in a steady and precipitous decline. Though the reasons have been speculated upon (mainly the debate is whether this is caused by low demand or high inventory), what is more important for speculators in the oil market is where prices are going. Around the beginning of February, prices have reversed their long and persistent decline by finally showing a rally. While this gives hope to many investors, especially those who bought oil companies hoping for a quick recovery, there are signs that there is still more pain to come. RSI and Technical Expectations (click to enlarge) To follow oil prices and technical indicators, I have shown a chart of the United States Oil Fund (NYSEARCA: USO ). A clear downtrend is apparent starting in June and continuing all the way to January. Since last month, the decline slowed noticeably, and starting in February, there is a decent correction forming. While the recent price increase is a case for optimism, a closer analysis reveals that the bear market may not be hibernating quite yet. Firstly, in bear markets, RSI tends to oscillate between 10 and 60. RSI is currently at around 50, and for real hope that this market is over, a value over 60 has to be there. Secondly, the most recent prices are showing that the 50-day moving average is unable to be surpassed, as USO hit that value, but then retraced after touching it. That said, a breakout is still possible, but with RSI hitting a wall below 60 and the price retracing at the 50-day moving average, the bear market is still well in place. Minor corrections are a part of bear markets, and this minor correction seems like exactly that, not a breakout. Fundamental Expectations The biggest factor that analysts are looking at right now is oil production. Once production finally decreases, we may then finally see the price of oil increase. While rig count can give a clue about production, it is not itself production, and production can still increase while rig counts are falling. Thus, the recent analysis by Citigroup ought to be concerning for any oil investors. It recently stated that: Despite global declines in spending that have driven up oil prices in recent weeks, oil production in the U.S. is still rising, wrote Edward Morse, Citigroup’s global head of commodity research. Brazil and Russia are pumping oil at record levels, and Saudi Arabia, Iraq and Iran have been fighting to maintain their market share by cutting prices to Asia. The market is oversupplied, and storage tanks are topping out. The same article noted that prices could fall as low as $20 per barrel. Clearly, these analysts are not buying this recent correction, nor should you. The low prices are here, and they are not going anywhere quite yet. Should We Trust Citigroup’s Analysis The question then becomes whether Citigroup is offering valid analysis, or is simply trying to change market sentiment to its benefit. To answer this question, I looked at the U.S. Field Production of Crude Oil offered by the EIA. (click to enlarge) The large increase in production since 2010 is obvious. The question now is whether US producers have taken steps to cut production now that oil prices have fallen so dramatically. To this end, a graph of year-over-year changes in production is shown. (click to enlarge) Clearly up to the latest data taken, no slowdown is found. In fact, not even a loss of momentum is apparently present. Production is increasing as quickly as it ever has, and based on this data, production is still not declining. December and January may show changes, but clearly the oil industry has a long way to go if production is going to be significantly cut in response to oil prices. Summary and Action to Take Oil is definitely not for the faint of heart right now. While I am uncertain about whether prices will actually fall to $20, I am fairly confident that oil prices are not poised for a sustainable rise quite yet. I would stick clear of USO for now, though outright shorting seems like an excessively risky move. Conversely, now would be a great time to load up on oil companies that are well poised to weather this low price environment. The way I would do this is with companies that have low debt and a good coverage ratio on their dividend. Helmerich & Payne (NYSE: HP ) is a great way to play a future correction, as it has very low debt and a current yield above 4%. There are other great companies to play the correction, though even staying put would be apt until we see further evidence that prices should rise. I would wait until production starts to decrease before investing in USO. Disclosure: The author is long HP. (More…) The author wrote this article themselves, and it expresses their own opinions. The author is not receiving compensation for it (other than from Seeking Alpha). The author has no business relationship with any company whose stock is mentioned in this article.

3 Under-The-Radar ETF Breakout Contenders

Summary With the market trading in a wide range since the beginning of the year, many momentum investors may be searching for signs of life in alternative areas. Several ETFs are showing positive technical divergences or signs of breakout that may warrant closer scrutiny. Solar stocks, consumer discretionary, and mid-cap stocks are excellent contenders. With the SPDR S&P 500 ETF (NYSEARCA: SPY ) trading in a wide range since the beginning of the year, many momentum investors may be searching for signs of life in alternative areas of the market. Just because the broad measure of U.S. stocks is waffling sideways, doesn’t mean that there aren’t suitable ETF candidates to add to your watch list at this juncture. The following funds are just a few of the ETFs I have been monitoring over the past several weeks as they show positive technical divergences from their peers. Guggenheim Solar ETF (NYSEARCA: TAN ) Solar stocks had a horrific year in 2014 that included various whipsaws and other erratic price action. They finished the year markedly lower despite positive net strength in large-cap indices such as SPY. However, they may be looking to turn those fortunes around in 2015 and have been showing a bias towards higher prices since bottoming in January. TAN is the largest renewable energy ETF with over $300 million in total assets. This fund tracks 29 global solar energy companies engaged in the manufacture, installation, and maintenance of solar power equipment. The index is composed of 47% U.S.-based companies, with the remaining allocation spread amongst China, Hong Kong, and other smaller nations. As you can see on the chart below, TAN had some brief consolidation at its 50-day moving average and is now marching back towards its long-term 200-day moving average. Since the beginning of the year, this ETF has gained more than 9% and is continuing to show positive relative strength versus many sector alternatives. Aggressive growth investors who can stomach heightened volatility may want to research solar ETFs as a possible comeback story for 2015. Consumer Discretionary Select Sector SPDR (NYSEARCA: XLY ) Consumer discretionary stocks are another area of the market that has shown strong momentum through earnings season. XLY is heavily dominated by media, specialty retail, and other luxury goods sellers such as Walt Disney (NYSE: DIS ) and Home Depot (NYSE: HD ). This ETF contains 87 large-cap stocks and charges an expense ratio of 0.15%. The strong vote of confidence for this sector came when it recently broke out above its 2014 highs and is continuing to show impressive overall strength. Many investors consider this ETF to be an indicator of consumer health, and judging by the price action, the trend of consumer spending habits continues in earnest. XLY will certainly be an important sector of the market to watch as a potential growth-focused momentum trade in 2015. iShares Core S&P Mid-Cap ETF (NYSEARCA: IJH ) Mid-cap stocks are another area of the market, similar to XLY, which has newly peeked out above its 2014 highs. IJH is the largest ETF in this space that tracks 400 mid-sized companies with market capitalization between $1.5 billion and $5 billion. This fund has over $24 billion in total assets and charges a modest expense ratio of 0.12%. While mid-cap stocks don’t always get as much recognition as their large or small-cap peers, they do have the potential to be successful long-term growth candidates. The positive technical move in this space should be viewed as a sign of building momentum that may lead to outperformance versus SPY in 2015. For my growth clients, I am accessing the mid-cap space through the Vanguard Mid-Cap ETF (NYSEARCA: VO ). This passive index follows a similar basket of 375 stocks and includes a lower expense ratio at 0.09%. The Bottom Line These growth themes show promising characteristics of momentum and strength versus plain-vanilla ETF alternatives. However, any new entrants in these ETFs should implement a stop loss or sell discipline to define your risk management strategy. In addition, when starting a new position, I typically recommend breaking up the trade in pieces so that you can add slowly over a limited time. This allows you to better control your cost basis and allocation size. Disclosure: The author is long VO. (More…) The author wrote this article themselves, and it expresses their own opinions. The author is not receiving compensation for it. The author has no business relationship with any company whose stock is mentioned in this article. Additional disclosure: David Fabian, FMD Capital Management, and/or clients may hold positions in the ETFs and mutual funds mentioned above. The commentary does not constitute individualized investment advice. The opinions offered herein are not personalized recommendations to buy, sell, or hold securities.

3 Low Beta ETFs For A Choppy Market

The U.S. stock market is caught in a web of uncertainty since the start of this year and sees little chance of it clearing up in the months ahead. This is primarily thanks to geopolitical tensions, sliding oil prices, turmoil in Greece, sluggish European and Japanese growth, weakness in key emerging markets, and weak corporate earnings. Additionally, the currency war has escalated with many countries choosing loose monetary policies to stimulate growth and prevent deflationary pressure. This is in contrast to the U.S. Fed policy of tightening the stimulus. The diverging central bank policies have propelled the U.S. dollar against the basket of various currencies to multi-year highs. Further, both the World Bank and International Monetary Fund (IMF) recently cut their growth forecast for the next two years. The World Bank projects the global economy to expand 3% this year and 3.3% in the next, down from 3.4% and 3.5%, respectively. On the other hand, IMF lowered its global growth outlook to 3.5% from 3.8% for 2015, representing the sharpest cut in three years. Growth for 2016 is forecast at 3.7% versus the previous projection of 4%. Another reason for the recent market pullback has been the U.S. monetary policy, wherein the Fed is on track to raise interest rates but the timing is still uncertain. Amid these uncertainties, investors are seeking exposure to alternative sources of income rather than equity and bonds. For these investors, an allocation to low beta funds could be the safest bet, as long as the disorder lingers. Why Low Beta? Beta measures the price volatility of the stocks or funds relative to the overall market. It has a direct relationship to the market movements. A beta of 1 indicates that the price of the stock or fund tends to move with the broader market. A beta of more than 1 indicates that the price tends to move higher than the broader market and is extremely volatile while a beta of less than 1 indicates that the price of the stock or fund is less volatile than the market. With that being said, low beta ETFs exhibit greater levels of stability than their market sensitive counterparts and will usually lose less when the market is crumbling. Though these have lesser risks and lower returns, the funds are considered safe and resilient amid uncertainty. However, when markets soar, these low beta funds experience lesser gains than the broader market counterparts and thus, lag their peers. Given the huge levels of volatility in the market, investors could find the following ETFs as intriguing options until the market track becomes clear. WisdomTree Managed Futures Strategy ETF (NYSEARCA: WDTI ): Beta – 0.02 This actively managed fund seeks to deliver positive returns in rising or falling markets that are uncorrelated to equity or fixed income returns. It uses a quantitative, rules-based strategy to provide returns that correspond to the performance of the Diversified Trends Indicator and invests in a combination of U.S. treasury futures, currency futures, commodity futures, commodity swaps, U.S. government and money market securities. This strategy seeks to benefit from both rising or declining price trends via long and short positions in commodity, currency, and U.S. treasury futures market. The product has amassed $209.9 million in asset base and trades in a light volume of about 34,000 shares a day. Expense ratio came in at 0.95%. The fund has added 0.3% so far in the year. QuantShares U.S. Market Neutral Size ETF (NYSEARCA: SIZ ): Beta – 0.14 This fund invests in low capitalization securities while at the same time short high capitalization stocks of approximately equal dollar amounts within each sector. It seeks to deliver the spread return between high and low ranked stocks. This can easily be done by tracking the Dow Jones U.S. Thematic Market Neutral Size Index. The product holds a long position in 200 stocks and a short position in another basket of 201 stocks. It will generate positive returns when the basket of long stocks outperforms the short portfolio. The fund is expensive charging 1.49% in fees per year and trades in a paltry volume of under 1,000 shares per day. BTAL is unpopular having AUM of $1.2 million and has added 0.9% so far this year. IQ Hedge Market Neutral ETF (NYSEARCA: QMN ): Beta – 0.19 This product tracks the IQ Hedge Market Neutral Index, which seeks to replicate the risk-adjusted return characteristics of hedge funds using a market neutral hedge fund strategy. It invests in both long and short positions in asset classes while minimizing exposure to systematic risk. This strategy seeks to have a zero beta exposure to one or more systematic risk factors including the overall market (as represented by the S&P 500 Index), economic sectors or industries, market cap, region and country. The portfolio consists of a variety of ETFs including a number of fixed income funds and equity funds. The ETF allocates heavy weights in fixed income products like the Vanguard Short-Term Bond ETF (NYSEARCA: BSV ), the iShares 1-3 Year Treasury Bond ETF (NYSEARCA: SHY ) and the Vanguard Total Bond Market ETF (NYSEARCA: BND ) focusing on Treasury and corporate securities that are of high quality. The ETF is often overlooked by investors in the hedge fund space with AUM of just $15.3 million and average daily volume of about 3.000 shares. It charges 85 bps in fees and expenses and is up 0.2% in the year-to-date timeframe. Bottom Line These products could be worthwhile for low risk tolerance investors and have the potential to outperform the broad market, especially if market uncertainty persists over the coming months.