Tag Archives: nysearcaxly

Wall Street Celebrates Amazon Q2: ETFs To Benefit

After two technology giants – Apple (NASDAQ: AAPL ) and Microsoft (NASDAQ: MSFT ) – disappointed investors early in the week, Amazon (NASDAQ: AMZN ) came up with blockbuster second-quarter results after the closing bell on Thursday. This injected fresh optimism into Wall Street. The online e-commerce behemoth reported a huge earnings beat of over 200% with a bullish outlook on the third quarter. The company earned 19 cents compared to the Zacks Consensus Estimate of loss of 15 cents per share. This represents the third consecutive quarterly earnings beat for Amazon. Moreover, the company swung back to earnings from the loss of 27 cents reported in the year-ago quarter. Revenues climbed 20% year over year to $23.2 billion and were well ahead of the Zacks Consensus Estimate of $22.3 billion. Incredible performances were primarily driven by accelerating growth in the North American market, continued strength in cloud computing business and new initiatives to lure customers to fend off competition. Notably, revenues in North America grew 26% year over year while cloud computing revenue jumped 81%. The company projects revenue growth of 13-16% for the ongoing third quarter to $23.3-$25.5 billion, the midpoint is much higher than our current estimate of $23.77 billion. The guidance includes record Prime Day sales last week. Amazon also expects operating loss of $480 million to income of $70 million compared with a loss of $544 million in the same period last year. Market Impact Based on solid results and an optimistic outlook, shares of AMZN spiked as much as 19% to a new all-time high in after marker hours. This has pushed Amazon’s market cap higher to $262.7 billion, more than the market cap of $233.5 billion of the world’s largest retailer Wal-Mart (NYSE: WMT ). Including the after-market gains, the stock is up about 82% from a year-to-date look. In addition, the stock surged 22% in the pre-market session today. Impressed by Amazon’s stellar Q2 result, many analysts revised their target prices upward on the stock. Amazon, which turned 20 on July 16, has a Zacks Rank #2 (Buy) and a solid Industry rank (in the top 40%) at the time of writing as per the Zacks Industry Rank, suggesting significant upside for the stock over the coming days. Further, the stock has a Momentum Style Score of ‘A’. The smooth trading in the stock will definitely spread into the ETF world, especially the funds with the highest allocation to this Internet giant. Below we have highlighted some of these that would be in focus in the coming days: Market Vectors Retail ETF (NYSEARCA: RTH ) This fund provides exposure to the 26 largest retail firms by tracking the Market Vectors U.S. Listed Retail 25 Index. Of these, AMZN takes the top position in the basket with 10.8% share. The ETF has a certain tilt toward specialty retail, which accounts for 30% share while hypermarkets (13%), drug stores (13%) and department stores (12%) round off to the next three spots. The product has amassed $221.6 million in its asset base and charges 35 bps in annual fees. Volume is moderate as it exchanges nearly 92,000 shares per day. RTH has gained 8.6% in the year-to-date time frame and has a Zacks ETF Rank of 1 or ‘Strong Buy’ rating with a Medium risk outlook. First Trust DJ Internet Index ETF (NYSEARCA: FDN ) This is one of the most popular and liquid ETFs in the broad technology space with AUM of $3.4 billion and average daily volume of more than 320,000 shares. The fund tracks the Dow Jones Internet Composite Index and charges 54 bps in fees per year. In total, the fund holds 43 stocks with Amazon taking the second spot at 9.7%. From a sector look, Internet mobile applications account for nearly three-fifths of the portfolio while Internet retail makes up for 26%. The ETF has surged 17.4% so far this year and has a Zacks ETF Rank of 3 or ‘Hold’ rating with a High risk outlook. P owerShares NASDAQ Internet Portfolio ETF (NASDAQ: PNQI ) This fund follows the Nasdaq Internet Index, giving investors exposure to the broad Internet industry. The fund holds about 97 stocks in its basket with AUM of $224.4 million while charging 60 bps in fees per year. It trades in light volume of around 28,000 shares a day. Amazon occupies the third position with an 8.9% allocation. In terms of industrial exposure, Internet software and services makes up for 60% share in the basket, followed by Internet retail (36.1%). PNQI is up 16.1% in the year-to-date timeframe and has a Zacks ETF Rank of 4 or ‘Sell’ rating with a High risk outlook. Consumer Discretionary Select Sector SPDR ETF (NYSEARCA: XLY ) This product offers exposure to the broad consumer discretionary space by tracking the S&P Consumer Discretionary Select Sector Index. It is the largest and the most popular product in this space with AUM of nearly $11.3 billion and average daily volume of roughly 5.7 million shares. Holding 87 securities in its basket, Amazon takes the top spot with 7.7% of assets. Media dominates more than one-fourth of the portfolio while specialty retail, hotels restaurants and leisure, and Internet retail rounding off the next three spots with a double-digit allocation each. The fund has gained about 10% so far in the year and has a Zacks ETF Rank of 2 or ‘Buy’ rating with a Medium risk outlook. Link to the original post on Zacks.com
3 Under-The-Radar ETF Breakout Contenders

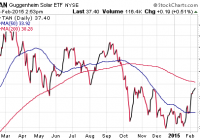
Summary With the market trading in a wide range since the beginning of the year, many momentum investors may be searching for signs of life in alternative areas. Several ETFs are showing positive technical divergences or signs of breakout that may warrant closer scrutiny. Solar stocks, consumer discretionary, and mid-cap stocks are excellent contenders. With the SPDR S&P 500 ETF (NYSEARCA: SPY ) trading in a wide range since the beginning of the year, many momentum investors may be searching for signs of life in alternative areas of the market. Just because the broad measure of U.S. stocks is waffling sideways, doesn’t mean that there aren’t suitable ETF candidates to add to your watch list at this juncture. The following funds are just a few of the ETFs I have been monitoring over the past several weeks as they show positive technical divergences from their peers. Guggenheim Solar ETF (NYSEARCA: TAN ) Solar stocks had a horrific year in 2014 that included various whipsaws and other erratic price action. They finished the year markedly lower despite positive net strength in large-cap indices such as SPY. However, they may be looking to turn those fortunes around in 2015 and have been showing a bias towards higher prices since bottoming in January. TAN is the largest renewable energy ETF with over $300 million in total assets. This fund tracks 29 global solar energy companies engaged in the manufacture, installation, and maintenance of solar power equipment. The index is composed of 47% U.S.-based companies, with the remaining allocation spread amongst China, Hong Kong, and other smaller nations. As you can see on the chart below, TAN had some brief consolidation at its 50-day moving average and is now marching back towards its long-term 200-day moving average. Since the beginning of the year, this ETF has gained more than 9% and is continuing to show positive relative strength versus many sector alternatives. Aggressive growth investors who can stomach heightened volatility may want to research solar ETFs as a possible comeback story for 2015. Consumer Discretionary Select Sector SPDR (NYSEARCA: XLY ) Consumer discretionary stocks are another area of the market that has shown strong momentum through earnings season. XLY is heavily dominated by media, specialty retail, and other luxury goods sellers such as Walt Disney (NYSE: DIS ) and Home Depot (NYSE: HD ). This ETF contains 87 large-cap stocks and charges an expense ratio of 0.15%. The strong vote of confidence for this sector came when it recently broke out above its 2014 highs and is continuing to show impressive overall strength. Many investors consider this ETF to be an indicator of consumer health, and judging by the price action, the trend of consumer spending habits continues in earnest. XLY will certainly be an important sector of the market to watch as a potential growth-focused momentum trade in 2015. iShares Core S&P Mid-Cap ETF (NYSEARCA: IJH ) Mid-cap stocks are another area of the market, similar to XLY, which has newly peeked out above its 2014 highs. IJH is the largest ETF in this space that tracks 400 mid-sized companies with market capitalization between $1.5 billion and $5 billion. This fund has over $24 billion in total assets and charges a modest expense ratio of 0.12%. While mid-cap stocks don’t always get as much recognition as their large or small-cap peers, they do have the potential to be successful long-term growth candidates. The positive technical move in this space should be viewed as a sign of building momentum that may lead to outperformance versus SPY in 2015. For my growth clients, I am accessing the mid-cap space through the Vanguard Mid-Cap ETF (NYSEARCA: VO ). This passive index follows a similar basket of 375 stocks and includes a lower expense ratio at 0.09%. The Bottom Line These growth themes show promising characteristics of momentum and strength versus plain-vanilla ETF alternatives. However, any new entrants in these ETFs should implement a stop loss or sell discipline to define your risk management strategy. In addition, when starting a new position, I typically recommend breaking up the trade in pieces so that you can add slowly over a limited time. This allows you to better control your cost basis and allocation size. Disclosure: The author is long VO. (More…) The author wrote this article themselves, and it expresses their own opinions. The author is not receiving compensation for it. The author has no business relationship with any company whose stock is mentioned in this article. Additional disclosure: David Fabian, FMD Capital Management, and/or clients may hold positions in the ETFs and mutual funds mentioned above. The commentary does not constitute individualized investment advice. The opinions offered herein are not personalized recommendations to buy, sell, or hold securities.

Consumer Discretionary ETF: XLY No. 7 Select Sector SPDR In 2014

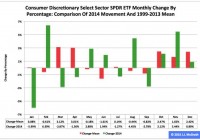
Summary The Consumer Discretionary exchange-traded fund finished seventh by return among the nine Select Sector SPDRs in 2014. The ETF was relatively weak in the first and third quarters, absolutely strong in the second and fourth quarters. Seasonality analysis of Q1 is a mixed bag, but my data interpretation points to a middle-of-the-pack performance. The Consumer Discretionary Select Sector SPDR ETF (NYSEARCA: XLY ) in 2014 ranked No. 7 by return among the Select Sector SPDRs that partition the S&P 500 into nine pieces. On an adjusted closing daily share-price basis, XLY advanced to $72.15 from $65.91, a gain of $6.24, or 9.47 percent. Thus, it behaved worse than its sibling, the Utilities Select Sector SPDR ETF (NYSEARCA: XLU ) and parent proxy, the SPDR S&P 500 Trust ETF (NYSEARCA: SPY ) by -19.27 and -4.00 percentage points, respectively. (XLY closed at $70.51 Tuesday.) XLY ranked No. 2 among the sector SPDRs in the fourth quarter, when it led SPY by 3.74 percentage points and lagged XLU by -4.54 points. And XLY ranked No. 3 among the sector SPDRs in December, when it performed better than SPY by 1.15 percentage points and worse than XLU by -2.68 points. Figure 1: XLY Monthly Change, 2014 Vs. 1999-2013 Mean (click to enlarge) Source: This J.J.’s Risky Business chart is based on analyses of adjusted closing monthly share prices at Yahoo Finance . XLY behaved about the same in 2014 as it did during its initial 15 full years of existence based on the monthly means calculated by employing data associated with that historical time frame (Figure 1). The same data set shows the average year’s weakest quarter was the third, with an absolutely large negative return, and its strongest quarter was the fourth, with an absolutely larger positive return. Generally consistent with this pattern last year, the ETF had a very small gain in Q3 and a very large gain in Q4. Figure 2: XLY Monthly Change, 2014 Versus 1999-2013 Median (click to enlarge) Source: This J.J.’s Risky Business chart is based on analyses of adjusted closing monthly share prices at Yahoo Finance. XLY performed worse in 2014 than it did during its initial 15 full years of existence based on the monthly medians calculated by using data associated with that historical time frame (Figure 2). The same data set shows the average year’s weakest quarter was the third, with a relatively large negative return, and its strongest quarter was the fourth, with an absolutely large positive return. It also shows there is no historical statistical tendency for the ETF to explode in Q1. Figure 3: XLY’s Top 10 Holdings and P/E-G Ratios, Jan. 13 (click to enlarge) Note: The XLY holding-weight-by-percentage scale is on the left (green), and the company price/earnings-to-growth ratio scale is on the right (red). Source: This J.J.’s Risky Business chart is based on data at the XLY microsite and Yahoo Finance (both current as of Jan. 13). To me, many of XLY’s component companies appear mispriced, either by a little or by a lot (Figure 3). I discussed one of them in “Amazon.com: The Most Overvalued Profitable Company In The S&P 500, Still” a while ago. Since then, Amazon (NASDAQ: AMZN ) has slipped back to unprofitability from profitability, but it remains overvalued. However, the facts on the S&P 500 consumer-discretionary sector reported by S&P Senior Index Analyst Howard Silverblatt Dec. 31 seem to be at variance with my opinions about it: He calculated its P/E-G ratio as 1.15, the lowest level of any of the index’s 10 sectors. Harrumph. The valuation issue aside, XLY’s prospects may be brighter now than they were six months ago: Among the Select Sector SPDRs, the ETF might be the biggest beneficiary of the collapse in the crude-oil commodity market, where the CME Group front-month futures price per barrel fell to $45.89 Tuesday from $107.26 June 20, a tumble of $61.37, or 57.22 percent, according to the U.S. Energy Information Administration . (The contract settled at $48.48 Wednesday, the CME Group reported.) Therefore, I would be completely unsurprised should XLY be a middle-of-the-pack performer among the sector SPDRs this quarter. Disclaimer: The opinions expressed herein by the author do not constitute an investment recommendation, and they are unsuitable for employment in the making of investment decisions. The opinions expressed herein address only certain aspects of potential investment in any securities and cannot substitute for comprehensive investment analysis. The opinions expressed herein are based on an incomplete set of information, illustrative in nature, and limited in scope. In addition, the opinions expressed herein reflect the author’s best judgment as of the date of publication, and they are subject to change without notice.