Tag Archives: lists

Buy Russia: Now A Bargain At Just About 6 Times Earnings

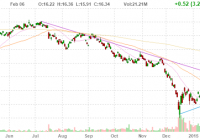
Russian stocks are very cheap at just over 6 times earnings and should be appealing for bargain hunters and contrarians. Weak oil prices have hurt Russia’s economy, but oil may have bottomed out and could rise in the future. The issue with Ukraine remains a wild card, but it appears that all parties have too much to lose and that means a resolution could be likely. The plunge in oil prices and the increasingly stiff sanctions over Russia’s foray into Ukraine have taken a big toll on the economy and the stock market. The negative headlines are likely to continue for awhile when it comes to Ukraine, but as far as the price of oil goes, things seem to be looking up thanks to a recent rebound. I am wary about investing in Russia because the geopolitical risks are significant and there are also currency and other risks. However, when valuations get to very cheap levels, it is hard to resist buying a bargain. Because of the numerous ongoing risks, I can’t allow myself to invest heavily in Russian stocks, but the cheap valuation makes me want to buy small position in the Market Vectors Russia ETF (NYSEARCA: RSX ). Let’s take a closer look: (click to enlarge) As the chart above shows, this ETF was trading for about $26 per share in July 2014, but has since plunged into the low teens. However, it is worth noting that since December, there has been a solid rally as indicated by the light blue uptrend line. Over the last few weeks, oil also appears to have bottomed out and if so, this is a major positive for Russia’s economy. Even so, that leaves the risk of war and sanctions. The sanctions have certainly started to impact the Russian economy, and it could not really come at a worse time because of the plunge in oil prices. If oil prices were still around $80 to $100 per barrel, I believe that Russia could afford to take a more protracted and antagonistic stance when it comes to Ukraine. The fact that oil is about 50% below the 2014 highs, makes me think that Putin will want to be a little more negotiable when it comes to finding solutions with the West that could lift sanctions. Over the last few days, Putin has been meeting with Germany’s Merkel, President Hollande of France, Ukraine’s leader, Petro Poroshenko and other leaders in order to find solutions. If these talks fail, the chance of war might increase which could cause Russian stocks to re-test recent lows. There is a lot at stake for all parties, especially for Russia and many European nations because of significant trade and because they rely on Russian natural gas. In a worst case scenario, Putin could shut off natural gas pipelines to Ukraine and Europe which would be a real blow to those economies. While those are significant risks, it seems like too much is at stake and I don’t see what any of the parties have to gain by escalating matters. On the positive side, if oil has bottomed out and if a cease fire is agreed to and sanctions are eventually lifted, Russian stocks could have significant upside. Russia is here to stay and this nearly perfect storm of weak oil prices and sanctions might be a fantastic buying opportunity. The Market Vectors Russia ETF has a price to earnings ratio of just about 6.5 times earnings. Right now, the S&P 500 Index (NYSEARCA: SPY ) trades for nearly 18 times earnings. The Market Vectors Russia ETF has significant exposure to the oil industry as well as other commodities. Below, you can see the top ten holdings : (data sourced from Yahoo Finance) Top 10 Holdings (57.78% of Total Assets) Chris DeMuth Jr. is a Seeking Alpha contributor, and I believe he is also an extremely savvy investor. He recently wrote about the opportunities in Russia and pointed out metrics which show just how cheap the Russian market is now, he states : “Concerns about Russia have driven down the price of its equity market. Russia’s total market cap is only 17% of its GDP, one of the lowest in the world. This is its historical minimum and far below its maximum of 142% during the past fifteen years. Over the past eight years, its GDP has grown by over 13% per year.” Marc Faber is a well-known investor, and he is also seeing a potential buying opportunity when it comes to Russian equities. He believes Central Banks have inflated asset prices through money printing but that “low valuations” in Russia are worth considering. His views were discussed in a Bloomberg article which stated: “Russian assets may move into some kind of a buying range,” Faber told an investor briefing in London. “They can go lower but they’re moving into a buying range.” Shares in the MSCI Russia index trade at an 80 percent discount to their U.S. counterparts based on their price-to-earnings ratio, compared with an average discount of 50 percent since 2003, Datastream data showed. Russian assets are clearly cheap, and could get cheaper. You should expect volatility to continue. Because of this it makes sense to buy only a small amount and average in over time. It also makes sense to have a long-term time frame. Ten years from now, I doubt the “Ukraine Crisis” will still be top headline news and I also doubt oil will be trading for $50 per barrel. If that is the case, a little investment in Russia could pay off big in the future. Data is sourced from Yahoo Finance. No guarantees or representations are made. Hawkinvest is not a registered investment advisor and does not provide specific investment advice. The information is for informational purposes only. You should always consult a financial advisor. Disclosure: The author is long RSX. (More…) The author wrote this article themselves, and it expresses their own opinions. The author is not receiving compensation for it (other than from Seeking Alpha). The author has no business relationship with any company whose stock is mentioned in this article.

Short-Term VIX Futures Products Should Be Avoided Until Better Opportunities Arise

All four major VIX short-term futures ETPs are negative over the past six months. Backwardation has occurred much more frequently in the past three months. The VIX is signaling a lack of direction in the market. In this article, my main theme will be what the VIX futures are saying about the market and why you should be patient. We will take a look at some popular VIX ETFs such as the ProShares Ultra VIX Short-Term Futures ETF (NYSEARCA: UVXY ), the ProShares Short VIX Short-Term Futures ETF (NYSEARCA: SVXY ), the VelocityShares Daily Inverse VIX Short-Term ETN (NASDAQ: XIV ), and the iPath S&P 500 VIX Short-Term Futures ETN (NYSEARCA: VXX ). As you can see below, VIX futures have been in backwardation quite frequently, especially when compared to 2012, 2013, and the beginning of 2014. Last month, I published an article that recommended a shift in focus from the pure contango and backwardation strategy to the percentage of backwardation strategy. You can view that article here . I continue to recommend this strategy given the current market conditions. (click to enlarge) Over the past three years, we have enjoyed a relatively subdued VIX. Historically, this is not abnormal in a bull market. However, as seen in the chart below, these periods (within the last 25 years) have only lasted, at most, about five years. (click to enlarge) Chart obtained from Yahoo! Finance by Nathan Buehler If you have followed my past publications, you know I take an optimistic view towards the U.S. economy. I continue to be concerned about the level of debt and liabilities within the U.S. government. It seems, as a global economy, debt has become an acceptable part of the budget. Living beyond your means for a long period of time will eventually have consequences. When those consequences will affect the economy is when politicians begin to address the problem. I don’t see that happening anytime in the near future. The Federal Reserve has undoubtedly, in my opinion, been the number one driver of the VIX for the past five years. Through massive amounts of monetary stimulus and an ever reassuring tone, it has encouraged the market to record highs. My takeaway from current events is that the Federal Reserve will continue to support the market and the U.S. economy at any cost. I expect to see low rates for the foreseeable future unless inflation begins to run over the proposed targets. The current VIX is signaling a lack of direction in the market. There is uncertainty surrounding U.S. monetary policy going forward. When will rates rise and by how much are common questions being discussed. Global growth has been revised downward several times. Investors are unsure if the U.S. can continue to sustain growth in these challenging conditions. This is exactly what the VIX is intended to measure, uncertainty and fear. It is currently right on target. Both UVXY and VXX have outperformed their inverse counterparts over the past three months. This is especially positive for VXX considering it does not have the leverage that UVXY provides. This is something we have not seen, for a prolonged period of time, since 2011. All four instruments are negative over the past six months. As of 2/6/2015, VXX was down less than 1% over the same time period. (click to enlarge) Chart made by Nathan Buehler using historical VIX data obtained from the CBOE As you can see from the data above, over the past 11 years, we have only seen backwardation drop below -10% (significantly) five times. Given the current global economic outlook, I would not be surprised to see the VIX futures testing a -10% backwardation level sometime in 2015. When uncertainty in the VIX presents itself, the best tool to have in your investing portfolio is patience. Sometimes you will have missed opportunities, or feel that way, until you are rewarded for waiting patiently. You only need one correct trade a year in the VIX to outperform the major benchmarks. I have been extremely cautious over the last several months and it has paid off. Nothing has presented enough potential reward to balance the current risk. These back and forth swings in the market only decay the value of short-term ETPs (pro and inverse). My strategy has always been to short the VIX once “extreme” levels are breached. Different periods of economic activity dictate different levels of “extreme”. This strategy can be executed through purchasing inverse products, shorting pro-VIX products, options, or a combination. Please see my library and Instablog for more information on specific strategies. My current recommendation is to avoid all the short-term VIX-related products until a better opportunity presents itself. None of these products are buy-and-hold investments. If you have any questions or are new to trading the VIX, please view my library of articles to gain a better understanding of your risks. As 2015 progresses, I will continue to publish updates on the VIX futures and its related ETPs. I highly appreciate you reading and hope you find this information helpful in your investing decisions. Disclosure: The author has no positions in any stocks mentioned, and no plans to initiate any positions within the next 72 hours. (More…) The author wrote this article themselves, and it expresses their own opinions. The author is not receiving compensation for it (other than from Seeking Alpha). The author has no business relationship with any company whose stock is mentioned in this article.

CVY Brings Equities And Bonds To Create A Balanced Portfolio

Summary I’m taking a look at CVY as a candidate for inclusion in my ETF portfolio. I like the idea behind the ETF, but I’m not sold on using it over the portfolios I can create myself. The yields on the ETF are extremely high which may make it more appealing for retiring investors seeking income without touching their portfolios. The overall risk level isn’t bad at all, though the returns have been fairly moderate through my testing period. Investors should be seeking to improve their risk adjusted returns. I’m a big fan of using ETFs to achieve the risk adjusted returns relative to the portfolios that a normal investor can generate for themselves after trading costs. I’m working on building a new portfolio and I’m going to be analyzing several of the ETFs that I am considering for my personal portfolio. A substantial portion of my analysis will use modern portfolio theory, so my goal is to find ways to minimize costs while achieving diversification to reduce my risk level. In this article I’m reviewing the Guggenheim Multi-Asset Income ETF (NYSEARCA: CVY ). What does CVY do? CVY attempts to track the investment results of an index Zack’s Multi-Asset Income Index. The ETF falls under the category of “Large Value.” Does CVY provide diversification benefits to a portfolio? Each investor may hold a different portfolio, but I use the SPDR S&P 500 Trust ETF (NYSEARCA: SPY ) as the basis for my analysis. I believe SPY, or another large cap U.S. fund with similar properties, represents the reasonable first step for many investors designing an ETF portfolio. Therefore, I start my diversification analysis by seeing how it works with SPY. I start with an ANOVA table: (click to enlarge) The correlation is about 88%, which is low enough that I’m expecting to see some diversification benefits, but higher than I would like to see for having a unique tracking index. Standard deviation of daily returns (dividend adjusted, measured since January 2012) The standard deviation is going to make a stronger case for investing in CVY. For the period I’ve chosen, the standard deviation of daily returns was .698 %. For SPY, it was 0.748% over the same period. This may be a benefit of the mixed assets that the ETF is holding. Mixing it with SPY I also run comparison on the standard deviation of daily returns for the portfolio assuming that the portfolio is combined with the S&P 500. For research, I assume daily rebalancing because it dramatically simplifies the math. With a 50/50 weighting in a portfolio holding only SPY and CVY, the standard deviation of daily returns across the entire portfolio is 0.701%. The risk level on the portfolio drops relative to only holding SPY because of both the lower deviation from CVY and the correlation. Based solely on this information, it would appear an investor thinking about going all in on CVY could put about half in SPY and retain a similar risk level as long as the risk is measured in the daily volatility. If the position in SPY is raised to 80% while CVY is used at 20% the standard deviation of daily returns increases to .724%. At 5%, the standard deviation of the portfolio would have been 0.741%. If an investor was basing their decision solely on risk level, there could be significant incentives to using a large position in a relatively stable ETF like CVY. However, CVY has substantially underperformed SPY in the period, and I would expect that to be a long term trend because of the less aggressive portfolio that CVY is holding. Why I use standard deviation of daily returns I don’t believe historical returns have predictive power for future returns, but I do believe historical values for standard deviations of returns relative to other ETFs have some predictive power on future risks and correlations. While poor liquidity could impact the reliability of statistics, the ETF had 0 days with no trading volume, so price movements should be recorded as they happened. The average volume is currently around 330,000 shares per day. Yield & Taxes The distribution yield is 6.40%. It is a fairly massive yield, which may be an attractive factor for retirees hoping to live off the distributions. The high distributions will limit the growth rate of the investment in the fund, but for retirees that are concerned about overreacting to movements in the market, a high distribution ETF with lower volatility makes sense. Expense Ratio The ETF is posting .84% for a net expense ratio and .89% for the gross ratio, which is higher than I’d like to see. Unfortunately, most ETFs have expense ratios higher than I’d like to see. There may be some legitimate reasons for a high expense ratio, but I find ETFs with lower expense ratios to be substantially more attractive. One of the reasons I’m overhauling my portfolio is to get away from funds that have higher expense ratios. Market to NAV The ETF is trading at a .18% discount to NAV currently. I think any ETF is significantly less attractive when it trades above NAV. The discount looks very nice, but the discount is also less than one fourth of the annual expense ratio. In that context, the discount becomes less attractive as a feature of total return for a long term investor. Largest Holdings The diversification within the holdings is substantial. Due to the combination of equities and other funds included in the profile, I’ve prepared two charts for the holdings. The first shows the equity holdings and the second shows the other funds. (click to enlarge) (click to enlarge) Investing in the ETF is largely relying on modern portfolio theory. Making an investment requires a belief that markets are at least somewhat efficient so that the companies within the portfolio will be reasonably priced. Conclusion I love the idea of a diversified ETF that can deliver everything investors are seeking within a single ETF. However, I’d rather go with SPY (or an equivalent) and just eliminate the bond position entirely if I had to pick only one ETF. The lower standard deviation is great, but I think I can reach that point by composing a portfolio with individual selections of ETFs. The portfolio’s expense ratio can be justified, at least to some extent, by the excellent internal diversification and the very high turnover ratio. That turnover ratio is currently listed at 180%. Even though I don’t like high turnover ratios, I recognize that they do create more costs in running the ETF. I’m looking for a simple and stable ETF. While this one offers an appealing combination of lower standard deviation and moderate correlation, I don’t feel that the selection represents a superior position to what I can create. That’s the problem in a nutshell. The ETF did a solid job of diversifying, but it doesn’t seem to be a suitable replacement for an entire portfolio compared with just holding something like SPY. If an investor intends to hold several ETFs rather than one, then they can build the portfolio to their exact risk specifications. This ETF may be a great fit for any investors that want the exact risk factors the ETF has selected. The large yields and strong volumes may make the ETF much more appealing for retiring investors seeking strong yields for current income. For me, those benefits simply aren’t enough. Disclosure: The author has no positions in any stocks mentioned, and no plans to initiate any positions within the next 72 hours. (More…) The author wrote this article themselves, and it expresses their own opinions. The author is not receiving compensation for it (other than from Seeking Alpha). The author has no business relationship with any company whose stock is mentioned in this article. Additional disclosure: Information in this article represents the opinion of the analyst. All statements are represented as opinions, rather than facts, and should not be construed as advice to buy or sell a security. Ratings of “outperform” and “underperform” reflect the analyst’s estimation of a divergence between the market value for a security and the price that would be appropriate given the potential for risks and returns relative to other securities. The analyst does not know your particular objectives for returns or constraints upon investing. All investors are encouraged to do their own research before making any investment decision. Information is regularly obtained from Yahoo Finance, Google Finance, and SEC Database. If Yahoo, Google, or the SEC database contained faulty or old information it could be incorporated into my analysis. The analyst holds a diversified portfolio including mutual funds or index funds which may include a small long exposure to the stock.