Tag Archives: investing ideas

Buy-Ranked Gaming ETF In Focus
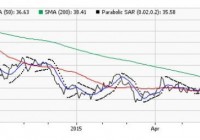
The once-thriving global gaming industry was badly hit by the slowdown in the Chinese economy that led to sluggish casino business in Macau – the world’s largest casino gaming destination. This is because the nationwide crackdown on corruption in China last year compelled Macau officials to impose restrictions on illegal money transfers in VIP gambling from mainland China to Macau. This has taken a toll on overall gambling revenues hurting the casino stocks at large. Additionally, smoking ban in casinos, tighter restrictions on visas and lower spending by high-stake gamblers added to the woes (read: 4 China A-Shares ETFs Pick Up After Gloom ). This 16-month bear trend now seems to be reversing with many casino stocks bouncing up from their lower levels. In particular, the U.S. casino giants like Las Vegas Sands (NYSE: LVS ), Wynn Resorts (NASDAQ: WYNN ), Melco Crown Entertainment Limited (NASDAQ: MPEL ) and MGM Resorts International (NYSE: MGM ) are up 4.5%, 2.6%, 5.5% and 1.5%, respectively, since the start of the second quarter. Hong Kong listed Galaxy Entertainment Group ( OTCPK:GXYEY ) added 5.6% while Sands China ( OTCPK:SCHYY ) moved higher by 15.1% so far this month. The impressive gains were brought in by the easing of tourist restrictions in Macau, and the possibility that bans on gaming-floor smoking rooms will be eased once operators maintain decorum and protect these rooms from harmful tobacco smoke. Effective July 1, mainland China passport holders transiting through Macau can stay there for two days longer and could gain entry into the city within 30 days instead of 60 days previously. This move will benefit casino operators in the months ahead. Further, the Chinese economy is stabilizing and casino operators in Macau are making efforts to diversify their businesses beyond gaming for additional revenue streams (read: ETFs to Play 3 Undervalued Sectors ). Apart from these, casino stocks seem extremely cheap at the current levels as the average valuation on Macau’s five biggest casino operators by market value has dropped to 18 times estimated earnings , about half of the peak reached in December 2013. This suggests an attractive point to enter the gaming market. Given this, investors could play this space with lower risk in a basket form rather than tilting toward individual companies. The Market Vectors Gaming ETF (NYSEARCA: BJK ) is the lone ETF providing investors global exposure to the casino gaming market. The fund has a Zacks ETF Rank of 2 or “Buy” rating with a High risk outlook (see: all the Top Ranked ETFs ). BJK in Focus This product follows the Market Vectors Global Gaming Index, holding 47 securities in its basket. It is concentrated on the top 10 holdings with the largest allocation going to Las Vegas, Galaxy Entertainment and Wynn Resorts that have combined to make up for 22.6% share. In terms of country exposure, U.S. takes the top spot at 36.8%, followed by China and Australia with 13% share each. The fund focuses on large caps at 56.2% while mid caps account for the remainder. From a style look, it has a nice mix of blend, value and growth securities, reflecting superior weightings. However, investors often overlook the fund as it has accumulated only $29.6 million in its asset base and trades in small volume of roughly 12,000 shares per day. This ensures additional cost in the form of wide bid/ask spread beyond the expense ratio of 0.65%, which is already at the higher end of the expense ratios prevailing in consumer discretionary ETF space. In terms of performance, BJK has been lagging the broad market and lost 24.2% in the trailing one-year period and 5.1% so far this year. But it recently broken its near-term range as depicted by the chart below, indicating some smooth trading in the weeks ahead. The fund’s short-term moving average (9-Day SMA) has managed to move ahead of the mid-term moving average (50-Day SMA) and is now treading toward the long-term (200-Day SMA) average, signaling upside for the fund. Further, the bullish trend is confirmed by the parabolic SAR, which is currently trading below the current price of the fund. Bottom Line Given the bullish technical indicators and improving fundamentals in Macau, investors could garner huge profits in the gaming industry with this top ranked ETF. Original post
An Alternative Way To View Diversification

We’re living in a post 2008-2009 financial crisis world. Investors and advisors alike know that having your eggs all in one basket could land you in some hot water (especially if it’s the arguably broken 60/40 portfolio). The reason being, one single person or group isn’t able to call what’s going to be the “best” asset class (by performance only) in any given year. Enter the ever so popular diversification quilt , which essentially ranks each asset class top to bottom over the past 15 years. The issue, of course, is that although they include 10 asset classes, they really don’t include alternative investments, specifically Managed Futures. The latest to release a chart like this is Business Insider. As you might remember, we took the liberty of changing around the “quilts” published by Bloomberg back in September by adding Managed Futures to the mix. The second issue with the quilt table is that these “quilts” are all on the same axis level. For example, if an investment was the worst performer of the year and still up 2 or 3 percent, it would look the same as an investment that came in last at a -10% on a different year. Which got us thinking how different would the table look if we spread out the investments so that the performance range would be visible? This is what we got. P.S – Looking at each asset class on its own fluctuates year to year, is just one way to look at volatility. So, so we connected the dots of the largest performance range (Emerging Markets), Managed Futures, and the smallest performance range (Cash). (click to enlarge) (Past performance is not necessarily indicative of future results) Source: Large Cap = S&P 500 Small Cap = Russell 2000 Intl Stocks = MSCI EAFE Emerging Markets = MSCI Emerging Markets REIT = FTSE NAREIT All Equity Index HG Bond = Barclay’s U.S. Aggregate Bond Index HY Bond =BoAML US High Yield Master II Cash= 3 Month T Bill Rate AA = Asset Allocation Portfolio (15% Large Cap, 15% Intl Stocks, 10% Small Cap, 10% Emerging Markets, 10% REIT, 40% HG Bond Share this article with a colleague

Duplicating The All-Weather Fund Using Low-Cost ETFs

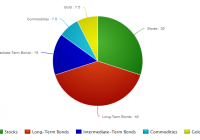
Summary Tony Robbins’ newest book reveals the asset allocation of Ray Dalio’s All-Weather Fund. The allocation is designed to balance the percentage of risk rather than the percentage of money to each asset. This strategy can be replicated using low-cost ETFs, but the biggest challenge is in sticking with the allocation as the years go by and each asset performs differently. Everyone in the business knows Ray Dalio is the manager of the world’s largest hedge fund, but his portfolio strategy has not always been very accessible by the public. Dalio has not added any clients in ten years, and even then, the only way to get access to the fund was with a net worth of at least four billion dollars and a minimum investment of 100 million dollars. Luckily, when Tony Robbins sat down with Dalio to interview him for his latest book , Ray shared the specifics of how he allocates the All-Weather fund. So this article will look at how to replicate that portfolio using a series of low-cost ETFs. Keep in mind that the fund does use leverage to increase the returns, and this allocation does not include any of the hedging activities. The large percentage allocated to bonds is a surprise to most, but the reasoning behind it is based on balancing the percentage of risk rather than the percentage of money put into each asset. Stocks are three times more volatile than bonds, so putting a higher percentage into bonds balances the risk in a way that putting 50/50 stocks and bonds wouldn’t. So the 15% in gold and commodities works the same way, as these are more volatile than both stocks and bonds. This approach is not all that different from Harry Browne’s permanent portfolio concept, which is a little more simple with 25% stocks, 25% bonds, 25% cash, and 25% gold. Swiss investor Marc Faber also recommends a similar allocation , 25% stocks, 25% bonds/fixed income, 25% real estate, and 25% gold. Dr. Faber’s portfolio is more suited towards very wealthy individuals, and it is closer to the “one third, one third, one third” concept that Jim Rickards talks about in regards to how wealthy families keep their wealth intact over many generations. The allocation is one third in land, one third in gold, and one third in fine art. This particular strategy takes a VERY long-term point of view and looks to protect and preserve wealth against any and all crises from depressions, wars, to hyperinflation. Dalio’s All-Weather fund is not centered around hedging against inflation/hyperinflation as much as the portfolios mentioned above, but the 15% in gold and commodities shows that he does have some concerns about inflation even though he might not think severe inflation is inevitable and imminent. In fact, it was the historic event in 1971 of President Nixon taking the US off the gold standard for good that greatly shaped Ray’s “all weather” strategy and realization that no one can really predict which investments will do best in the future. So here are the best choices of ETFs for replicating the All-Weather portfolio: 40% Long-Term Bonds Vanguard Long-Term Bond ETF (NYSEARCA: BLV ) With assets totaling 1.2 billion dollars, this fund invests in both government and investment-grade corporate long-term bonds. The mix of corporate bonds helps to give the yield a boost that one would not get by going only with government bonds. Of course, when you go with any Vanguard ETF, you are usually getting the lowest expense ratio in the industry, and with this particular ETF, the ER is only .10%. The yield is 4.05%. 15% Intermediate-Term Bonds Vanguard Intermediate-Term Bond ETF (NYSEARCA: BIV ) This popular fund is even bigger with total assets of 5.95 billion dollars. There are not too many differences between this fund and BLV, except that this fund of course holds only shorter-term bonds. The yield is 2.73%, and the expense ratio is also a very low .10%. For this 15% portion, you could also split it into two, with BIV on one side and a TIPS ETF on the other. 30% Stocks Vanguard S&P 500 ETF (NYSEARCA: VOO ) Only 30% in stocks seems very low compared to conventional wisdom. Again though, Dalio’s strategy puts the assets with the most volatility as a lower percentage of the portfolio. VOO is a large fund with 34.41 billion in assets . The expense ratio is .05%, which is very important for the long-term investor and the highlight of this ETF. The yield for VOO is 2.01%. In some of my recent articles, I have been highlighting ETFs that can provide income that would be cushioned from a major crash in the US, which I anticipate, although I won’t put a time on it. So, in that vein, I would add to this by splitting the equities portion of this strategy into two parts; one, domestic equities, and the other, international equities. For the international exposure, I think the Vanguard FTSE All-World Ex-US ETF (NYSEARCA: VEU ) is the best choice within this strategy. This ETF has 14.82 billion in assets , an expense ratio of .14%, and the yield is 2.81%. 7.5% Gold and 7.5% Commodities iShares Gold Trust ETF (NYSEARCA: IAU ) and PowerShares DB Commodity Index Tracking ETF (NYSEARCA: DBC ) This allocation to gold and commodities again goes against conventional wisdom. Considering the most recent downturn in gold, it would be even more difficult for most people to consider gold and commodities in their portfolio. It is easily the most hated commodity in world today, or at least it is the most hated in the financial mainstream media. Gold and the whole natural resource sector have been in a deflation since 2011, but that does not change the fact that since the late 90s, gold has outperformed the Dow, the S&P 500, as well as Berkshire Hathaway (NYSE: BRK.A ) (NYSE: BRK.B ). (click to enlarge) So, for this portion of the portfolio, IAU works best for the gold portion, because it has the lowest expense ratio of any gold ETF at .25%, as well as plenty of liquidity. For the commodities, DBC is a good choice. It tracks the DBIQ Optimum Yield Diversified Commodity Index Excess Return™ which has exposure to 14 of the most heavily traded commodities. While the expense ratio is higher than I would like at .85%, the fund offers exposure to the futures market without going through the actual trading process yourself. SA contributor Dan Bortolotti points out that this allocation did not provide mind-blowing returns over the past three decades (9.7% annualized returns) and that most people could not stomach any one asset going through turmoil while another asset is rising. The problem lies in the emotions of individual investors though, not in the actual portfolio. However you slice it up, it is going to be very difficult for most people to sit by while any part of their portfolio is not performing very well. The natural instinct is to sell the portion that is underperforming and be overweight the portion that is doing good. How many of the people who were 90% stocks and 10% bonds stuck with that strategy in 2008 when the crisis was going on? What about putting all your eggs in one basket, would that not cause tremendous pain when that one asset inevitably goes through a bear market? All that most people will need is basic asset allocation of their assets and the ability to stick with the allocation over a period of decades. Even for the person who is not a financial expert, the better option is to keep a core portfolio of low-cost and commission-free ETFs instead of letting a mutual fund do the same thing but with extra fees attached. Disclosure: I/we have no positions in any stocks mentioned, and no plans to initiate any positions within the next 72 hours. (More…) I wrote this article myself, and it expresses my own opinions. I am not receiving compensation for it (other than from Seeking Alpha). I have no business relationship with any company whose stock is mentioned in this article.