Tag Archives: investing ideas

Southern Company: Ready To Bounce
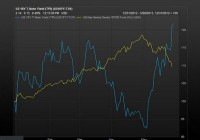
Utility stocks have gone from “hero” to “zero” in a month. Southern Company shows a historical pullback. Despite disappointing earnings, shares of Southern Company look poised to bounce from here. It’s hard to believe, I know, but the strongest sector among U.S. stocks last year was the utilities sector. The normally staid and stuffy Utilities Index returned over 30% in 2014, including dividends. Utility stocks, traditionally a safe haven for risk adverse, long-term investors, were suddenly the go-to place for a very different kind of financial animal: the “momentum stock” trader… at least for a while. All that ended in January this year. We’ve seen a substantial correction in the utilities sector so far this year, with many of the key players trading off 10% or more from their year-to-date highs. Analysts are laying blame on the strong rebound in treasury bond interest rates, which itself has been caused by the end of the Fed’s quantitative easing program (among other things). As rates climb, those looking for income and safety tend to pull money out of interest bearing stocks and put that money to work into safe havens like bonds and treasuries. This is why a chart of the 10-year yield with the utility stock index overlaid, shows a clear tendency of the two asset classes to mirror each other: [Source: MarketWatch ] I’m in the camp that counts this pullback in utilities as a great buying opportunity. Nothing has changed in the fundamentals of the underlying companies; and the lower share price makes their dividends all the more attractive. Right now, you’ll pay less for more utility yield, than at any time in the past 6 months. Among domestic utilities, there are 5 big players: NextEra Energy ( NEP , $46B), Dominion Resources ( D , $42B), Southern Company ( SO , $42B), American Electric ( AEP , $28B), and PG&E ( PCG , $26B). All 5 companies are trading around -10% below their 52-week highs. And all 5 companies have seen their dividend rates climb at least 50 basis points so far this year, making them attractive places to park cash for those looking for discounted income. My favorite among the big 5 is Southern Company . This utility company generates electricity through coal, nuclear, oil, gas, and hydro and distributes it in the states of Alabama, Georgia, Florida and Mississippi. Since peaking at $53.16 in late January as investors sought the relative safety of utilities, the stock has fallen about 14% in less than three weeks’ time, the largest pullback of the top 5. That is a move of statistical importance: it hasn’t been matched since the tail-end of the Great Recession, a time with a very different economic context. Shares are therefore ripe for a bounce from here. As of February 18th, the dividend yield of SO is 4.61%, which is currently about 110 basis points above the large-cap utilities index average. This is also the largest dividend payout among the top 5 utility companies, as the chart below demonstrates: As investors in the company know too well, at the last earnings announcement on February 4th, Southern reported quarterly revenues about 20% lower year on year, but they were, nevertheless, better than what analysts expected ( $4.1B actual vs. $3.7B expected). Quarterly earnings per share were in line with analyst estimates (0.38, adjusted for non-recurring costs, vs. 0.48 the previous year), and fiscal year 2014 showed a modest 3.7% rise in overall e.p.s., but shares still traded lower the next day by 2.6%. The reason for the selloff was that the company also lowered the range of its forward guidance; not by much, but enough to create disappointment. The causes of the drawdown in earnings were higher operating and maintenance costs, which jumped 33.4% to $1.3B, while the company’s total operating expenses for the period were over 10% higher than the prior year. There were also charges related to delays in the building of an $8 billion nuclear plant in Georgia, along with a drop in residential sales. The good news, however, is that industrial sales were up 3.3% quarter on quarter, and forward projected growth for the same is pegged at 1.7%. Both figures are much higher than industry average of 0.6%. The slowdown in retail sales, which hampered sales growth last quarter, is expected to rebound by 1.3% this next year: (click to enlarge) There are 22 Wall Street analysts who cover Southern Company. The majority of those, rate the company as either a “hold” (11) or a “sell” (10). There is only one “buy” rating on the stock (Argus). The consensus 12-month price target for SO is only $48, a mere 4.5% above current trading prices. With expectations so low, it won’t take much of a beat to generate a number of upgrades. As has been pointed out elsewhere, Southern’s management is extremely accurate in forecasting its next quarter’s earnings. In fact, Southern has not missed a forecast in ten years; and it typically predicts the narrowest guidance range in the industry. In the last announcement, the range was $0.08 on earnings of $2.80. The company nailed the top end of the range. With the guidance now lower than expected, it seems an easy task – given that track record – to show a nice upside beat. As the chart below shows, SO is in a deeply oversold condition. Shares have already completed a 61.8% Fibonacci retrenchment of its August to January run. They are also touching its 200-day moving average, which coincides with an area of former price support. The Relative Strength Index (RSI – 13) is printing a rare oversold reading below 30. All the above combine to make Southern Company a compelling buy for long-term investors, especially those looking for income. I consider shares to be attractive at this level, and I expect a rebound toward the 50-day moving average (currently: $49) over the next few weeks. If you buy the shares, you can collect the 4.6% dividend after 12 months. But in the Dr. Stoxx Options Letter, we have a way of collecting even more than that in half the time. Our put-write strategy allows us to collect a 5.5% dividend in 6 months, which annualizes to a 11% yield. This is a low-risk way of adding income to our investing capital, and if we are put the shares, we can always sell calls against the shares to lower our cost basis even further. Disclosure: The author has no positions in any stocks mentioned, and no plans to initiate any positions within the next 72 hours. (More…) The author wrote this article themselves, and it expresses their own opinions. The author is not receiving compensation for it (other than from Seeking Alpha). The author has no business relationship with any company whose stock is mentioned in this article.
Bond Fund Choices For Retiree Portfolios

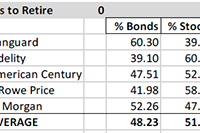
Summary Most retirees need/want some of their portfolio allocated to bond funds. For those with “about right” total assets for retirement, institutions recommend bond allocation of 40% to 60%. Numerous factors will tend to keep intermediate and long-term interest rates “lower for longer”. The middle of the bond yield curve is probably the best place to be. Corporate bonds and municipals make more sense than Treasuries for most individual accounts. Many retirees or near retirees need help deciding how to allocate between bonds and stocks, or how to prepare for a productive discussion about allocation and security selection with their advisor. This is intended to help those investors with the bond fund element of the decision. Fund Allocations: This table shows institutional recommendations for asset allocation for investors in the withdrawal stage of their financial lives, and with assets approximately sufficient for their needs (not great excess assets and not great deficiency – relative to lifestyle costs). Adjusting for Your Circumstances: According to the experts, retirees should be at or between these bond/stock allocation limits: 60/40 and 40/60. That allocation makes the global assumption that retiree assets are “just about right” – not way too little, or “way more than needed”. If assets are “way too little”, then retirement postponement, part-time work, and/or proportional reductions in standard of living is probably necessary; and the 60/40 to 40/60 allocation probably still makes sense. If assets are “way more than needed”, there are two reasonable alternatives to the 60/40 to 40/60 allocation. One alternative is to be more conservative, because the gradual loss of earning power in a heavy fixed income portfolio is seen as an acceptable trade-off to have a smoother ride. The other alternative is to be more aggressive – probably by investing “sufficient” assets in the 60/40 to 40/60 allocation, and then investing the balance in equities to grow the overall portfolio. Historical Results of 11 Bond/Stock Allocation Risk Levels: Using our 11 levels of allocation, experts recommend that you be in what we have labeled “Balanced-Conservative”, “Balanced Moderate” or “Balanced Aggressive”. This chart shows the 39-year historical returns for all 11 allocation levels, including mean return, best return and worst return, as well as the returns statistically expected at +/- 1, 2 and 3 standard deviations from the mean (roughly representing these probability ranges: 67%, 95% and 99.7%). This chart shows the returns of each allocation over multiple short and long-term periods. This chart shows the calendar year returns for 2008 through 2014 for each allocation. US Bond Funds Don’t Come In Just One Flavor, or Have One Outcome: Once you decide on the bond allocation level that makes sense, you might then want to consider what type, duration and quality of bonds to use. The allocation data above assumes aggregate US bonds (which has morphed over time as the relative level of government and corporate issuance changed, and as the relative levels of maturities have changed). You may wish to lock-in more predictably to a type or duration or quality for your portfolio, or to manage the mix as you see fit, instead of taking whatever the aggregate provides. You can do that with funds. Given that, let’s look at some of your choices: Corporate and Municipal Bonds Typically Best For Individuals: Corporate bonds or muni bonds are most likely to be suitable for you. Treasuries are generally best for tax-exempt investors (pensions, foundations, and foreign governments), while corporate and municipal bonds, with higher after tax returns are generally best for individuals. Corporate high yield did very well after the crash, but that party is over, and they have been faltering as of late, since the yield spread to Treasuries had reached a very low level. High-yield bonds have a high correlation with stocks and are not good counter cyclical diversifiers. Long-term corporates have done best as rates fell, and will continue to do well if interest rates decline, but will do poorly if rates increase. Short-term corporates have contributed least to return, and probably have more downside risk than normal, due to the Fed planning to exit QE by gradually raising short-term rates. Intermediate-term bonds are probably best bet. The muni charts are for nominal returns, which you have to gross up for your tax bracket. They have been more consistent in their returns, and their high-yield bonds have not suffered as corporate high yields have done – making them less correlated with stocks than high-yield corporate bonds. Yield, Duration and Quality Metrics for Bond Fund Types: Here are some metrics for the specific bond funds shown in the charts above. These two tables show yield, duration, quality, and quality composition of each representative fund. How Interest Rate Changes Impact Bond Prices: Here is how changes in interest rates impact bond values: Which Way Are Rates Likely to Go Near-Term? Some big names expect intermediate and long rates to decline, and short rates to rise, but not to historical “normal” levels. The inflation crowd expects rates to rise due to inflation. The anti-Fed crowd expected rates to rise when Fed bond buying ceased, but that did not happen. Most experts last year forecasted rising rates (I bit on that), but we were wrong. The “lower for longer” crowd (including Bill Gross, Jeff Gundlach and Robert Shiller) point out these factors: US Treasury rates are the highest among major developed market issuers – creating demand for our bonds, which raises prices and lowers yields. US currency is the strongest at this time among major currencies – creating demand for our bonds, which raises prices and lowers yields. Aging Baby Boomers, who have most of the money, are net savers (formerly net borrowers) reducing demand for loans, which tend to reduce bank offered rates, and they want to own bonds, raising prices and lowering yields. Aging Baby Boomers, are reaching for yield, and will rotate out of dividend stocks into bonds as rates rise, dampening rate increases. US corporations approach saturation debt, with lower net issuance, reducing supply vs. demand, which raises prices and reduces rates. Federal deficits are declining, which lowers Treasury issuance, reducing supply vs. demand, which raises prices and reduces rates. Municipal issuance is down, lowering supply vs. demand, raising prices and reducing rates. Why Foreign Money Will Flow to US Bonds: Here is data showing how much higher US rates are than German and Japanese rates, for example: Speculators, who believe the dollar will remain strong, can borrow in Germany or Japan in local currency, and use the money to buy US bonds and make a nice spread similar to the spread that banks make on their deposits. That increases Treasury prices and lowers yields. What Does The Treasury Yield Look Like Now? Here is where the US Treasury yield curve stands today (the black line). You can see that the yield on the long end of the curve has been declining, while the short end of the curve has been rising. Rates are far below the 2007 level (gray line), but are not expected to get back to that level any time soon. How Are The Pros Viewing The Path of Very Short-Term Rates? How far will the short end rise? Here is the Fed Funds futures curve, which forecasts a 1.9% short end 2 years from now. If the intermediate-term Treasuries stay as they are, the yield curve above would be flat, but that is some time away. It is unknown whether intermediate rates will rise to keep the curve steep or whether it will go flat. This forecast suggests that short-term bonds are probably not good opportunities. They do little good if rates stay the same, and they suffer if rates rise. Conclusion: Even for aggressive investors, some small allocation to bonds has historically improved total return and risk/reward. Knowing about the range of bond fund options, and how various bond allocations relate to your specific circumstances is an important step in setting up a retirement portfolio. There is a lot more to think about than what is presented in this short article, but for a huge number of retirees or near retirees, this is something they still have to get under their belt before they manage their own money, or prepare themselves for a productive discussion with their investment advisor. Disclosure: The author and clients have some of these funds in their portfolios in varying degrees based on individual specific circumstances. General Disclaimer: This article provides opinions and information, but does not contain recommendations or personal investment advice to any specific person for any particular purpose. Do your own research or obtain suitable personal advice. You are responsible for your own investment decisions. This article is presented subject to our full disclaimer found on the QVM site available here . Disclosure: The author has no positions in any stocks mentioned, and no plans to initiate any positions within the next 72 hours. (More…) The author wrote this article themselves, and it expresses their own opinions. The author is not receiving compensation for it (other than from Seeking Alpha). The author has no business relationship with any company whose stock is mentioned in this article. Additional disclosure: Disclosure: The author and clients have some of these funds in their portfolios in varying degrees based on individual specific circumstances.

The History Of The Global Equity Portfolio

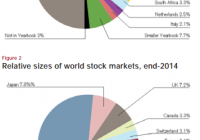
One of the nice things about thinking of the world in macro terms is that you are less inclined to fall victim to a fallacy of composition. That is, in the financial world we tend not to think in terms of aggregates so we often extrapolate personal or localized experiences into broader concepts which often results in mistakes. The most common economic fallacy of composition is thinking that if you save more then you’re better off, therefore everyone else should save more. This obviously can’t be true at the aggregate level because if everyone saved more then everyone would have less income. Likewise, in “the markets” we often think of “the market” as being something like the S&P 500 (or worse, the Dow 30) when the reality is that the “stock market” is a global market that is much broader than the S&P 500. And the financial markets are much broader than the stock markets. I got to thinking about all of this as I was going through the Credit Suisse Global Investment Returns Yearbook ( see here ). They had this fabulous chart of the dynamism of the global equity market over the last 100+ years: This chart is interesting because it shows a number of things. First, the USA was once a relatively small slice of the total market cap of outstanding stocks. Second, the reason the USA has performed so well over the last 100 years is, in large part, the result of a massive capture of market share by US corporations. This has huge implications for portfolios going forward. There is, in my opinion, a strong likelihood that the USA will lose market share to foreign firms as emerging markets become the growth engine of the world and the US economy matures and slows. So a slice of global equity market exposure not only makes sense for broad diversification, but also when considering a strategic allocation towards potentially higher growth regions. This image also shows how important it is to be dynamic and forward-looking in your portfolio to some degree. John Bogle recently made headlines for stating that a US investor shouldn’t be invested abroad. I’d be willing to bet if Bogle had been in the UK in 1899 talking about his portfolio preferences, he would have said a UK investor should stay fully invested in the UK. Why even bother investing in an emerging market like the USA? I am sure that investing in the USA back then looked fairly silly to a foreign investor. That was obviously a huge mistake. The point is, the future composition of the outstanding mix of global financial assets will change and investors who shun forecasting and some degree of necessary dynamism in their portfolios are very likely to generate returns that will be based on recency bias and extrapolative expectations (expecting the future to look like the past). One of the big lessons from history is that the future rhymes, but it rarely repeats. And a little bit of intelligent forecasting about what the future might look like could go a long way to helping your portfolio in the future. Are you Bullish or Bearish on ? Bullish Bearish Neutral Results for ( ) Thanks for sharing your thoughts. Submit & View Results Skip to results » Share this article with a colleague