Tag Archives: investing ideas

Debt Ratios And Pension Ratios: Connecting The Dots Between Them

A company with too much debt is like a tall vase with a narrow base. Everything looks fine until you kick the table, at which point it falls over and explodes into thousands of pieces. In an attempt to avoid companies that might explode, I always look for those with “prudent” amounts of debt. At the same time, I try not to be so restrictive that I can’t find anything to invest in. Avoiding companies with too much debt Over the years, I’ve defined “prudent” in several different ways, but my current rules of thumb for interest-bearing debts are: Only invest in a defensive sector company if its Debt Ratio is less than 5 Only invest in a cyclical sector company if its Debt Ratio is less than 4 (doesn’t apply to banks) The Debt Ratio , for reference, is the ratio between the company’s current total borrowings and its 5-year average post-tax profit (preferably normalised or adjusted profits). There is no magic to this; it’s just an approach which I’ve found to be reasonably good at differentiating between companies that are going to run into trouble because of their debts, and those that aren’t (I think I first read it in “Buffettology”, a book I highly recommend). Another financial obligation I’ve kept an eye on for the last few years is defined benefit pension schemes. Many companies don’t have one, but if a company does have one then in most cases (possibly all) it is legally obliged to ensure the pension scheme is well funded. If the pension scheme’s assets do not cover its long-term liabilities, the scheme will have a pension deficit and the company will have a legal obligation to close that deficit at some point. That will often mean shovelling cash into the fund, which means less cash for dividends or other things that create shareholder value. Avoiding companies with excessively large pension obligations I have a rule of thumb for pension obligations as well, just because I like to systemise my decision-making as much as possible. The rule is: Only invest in a company if its Pension Ratio is less than 10 The Pension Ratio is more or less the same as the Debt Ratio, only this time the company’s total defined benefit pension obligations are compared to its 5-year average post-tax profit. So far I’ve always looked at the Debt and Pension Ratios separately; I guess because I never thought about joining the dots, and because I haven’t seen anyone else look at debt and pension liabilities as two sides of the same coin. But last week, when I was reviewing my latest sell decision (June was a “sell” month for me), I noticed that the company in question ( Serco ( OTCPK:SECCF ) ( OTCPK:SECCY ), which I’ll write about soon) had both high levels of debt and a relatively large pension obligation. Specifically, Serco had a Debt Ratio of 5.2, which is too high according to my rules of thumb (Serco is in a cyclical sector and should have, by my rules, a Debt Ratio below 4). That alone would be enough to make me avoid buying the company, although not enough to make me sell it. It also had a Pension Ratio of 8.2, which is okay according to my Pension Ratio rule of thumb, but it’s pretty close to the limit of 10. That got me thinking. What if Serco had a slightly lower Debt Ratio? What if its Debt Ratio was 3.8 and its Pension Ratio was 8.2? That would be “okay” according to my rules of thumb, but is that a sensible outcome? Treating debt and pension obligations as interdependent risks If a company carries interest-bearing debts, then it will need to use cash to pay the interest on those debts. On the other hand, if a company has a large pension obligation then it either has, or could potentially have, a large pension deficit, and that would also require large amounts of cash to clear. Since there is only so much cash to go around, I think it’s sensible to look at these two financial obligations together, rather than in isolation. I don’t have some magical answer that will tell me exactly what a prudent amount of debt is for a company with a particular pension liability, or vice versa. However, I can take a reasonable guess, and refine it from there with experience. So my first stab at a rule of thumb which treats debt and pension obligations as if they impacted one another (because they do) is this: Only invest in a company if the sum of its Debt and Pension Ratios is less than 10 It isn’t rocket science, but I think it’s a good place to start. If, for example, a company has “medium” levels of debt, with a Debt Ratio of perhaps 3, then I would buy it (after a detailed analysis , of course) if its Pension Ratio is below 7. Or, if a company has a pension ratio of 8 then I’ll only buy it if the Debt Ratio is below 2. I think that should give me a fair balance between ruling out companies with excessive obligations, without being so restrictive as to rule out companies that are perfectly capable of handling their current situation. Of course, you may or may not use the same ratios as I do, but even if you don’t, I think treating debt and pension obligations as interdependent risks is still a sensible thing to do.
The Monsters Under The Bed Are Real For Consumer Staples Stocks

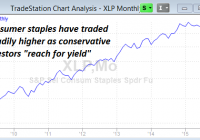
[ Editors Note: This is part one of our series on consumer staples stocks. Stay tuned for additional segments over the next few days.] Consumer staples stocks are considered some of the safest and most reliable equity investments available. Yet in today’s market, these stocks have hidden risks that could lead to serious losses for many conservative investors. Companies in the consumer staples category sell products that are used by consumers in both good times and bad. For example, shoppers aren’t likely to quit buying toothpaste, deodorant, and toilet paper just because their income dropped or they’re tightening the budget. Income investors love consumer staples stocks because the reliable businesses typically support robust dividend payments. In today’s low interest rate environment, these dividend payments are especially attractive to conservative investors who need income from their investment accounts. For the most part, consumer staples stocks are large blue-chip businesses with decades (if not centuries) of profitable operation. A long track record of profits make these stocks attractive for investors who want stability. In the investment business, professionals often overweight consumer staples stocks in the accounts of their most conservative investors. These “widow and orphan” stocks are supposed to be extremely safe for conservative customers. But today, these investments are likely to trade sharply lower. It’s a tragedy that the investors who can least afford to lose money will likely be the ones bearing the brunt of the losses over the next several months. While investors have been able to ignore these risks for quite some time now, the “monsters under the bed” are real (and very dangerous) when it comes to these traditionally safe investments. Two Major Risks For Consumer Staples Consumer staples stocks will likely trade sharply lower over the next few months because of two major factors: Extremely High Valuations Reach For Yield Unwind A stock’s earnings valuation tells us how much investors are willing to pay for a company, compared to how much profit that company will generate. According to Yardini Research Inc., the consumer staples sector is trading at a forward price/earnings (PE) ratio of 19.2. In other words, investors are paying $19.20 for every dollar that will be earned next year. This is the highest valuation seen in more than 15 years (since the dot-com bubble) . Part of the reason why consumer staples are trading at this high valuation is because income investors are reaching for yield . We all know that the Fed has kept interest rates at extremely low levels for years. While this may have helped to support the U.S. economy, an environment of low rates has hurt savers. Conservative investors who held money in CDs and other deposit accounts couldn’t generate as much income with rates lower. The only choice for many of these investors was to buy stocks that paid dividends. And since these investors were conservative by nature, the consumer staples sector was a natural place for them to invest their “safe” money into. The multi-year chart of the Consumer Staples Select Sector SPDR ETF (NYSEARCA: XLP ) below shows how this group of stocks has traded steadily higher over the period in which the Fed has kept rates at essentially zero. After a fantastic 6-year rally, the bullish trend for consumer staples is coming to an end. Valuations cannot be stretched much further, and a shift in the Fed’s interest rate policy spells trouble for this important group of income stocks. A New Era for Interest Rates During the financial crisis, the Federal Reserve lowered its federal funds target rate to a range between 0% and 0.25%. This target rate has significant influence over other interest rates including deposit accounts, mortgages and even bond yields. The Fed has kept the rate low in an effort to make cash cheap for financial institutions and to encourage lending. There’s also a strong argument that the Fed lowered rates in an attempt to inflate the stock market (making it easier for institutional investors to borrow cheaply and buy shares of stock – sending market prices higher). A discussion of Fed policy is outside the scope of this article. But suffice it to say that a period of low rates has helped to boost stock prices for consumer staples. And a reversal of that policy will likely have a very bearish effect on this sector. During the month of May, the U.S. economy added another 280,000 jobs. This figure came in well ahead of economists’ expectations. Meanwhile, the number of job openings in the U.S. rose to 5.4 million – the highest reading recorded since the Bureau of Labor Statistics started tracking the data in 2000. A strengthening labor market should lead to a Fed decision to raise rates this year. Already, traders are pricing in a probable rate hike when the Fed meets in September. Mortgage rates are already moving higher in anticipation of this hike, with the average rate on a new 30-year fixed mortgage now above 4%. Unwinding of the Reach For Yield When rates move higher, conservative investors will have more options for generating income. In particular, deposit accounts and treasury bonds will see their yields rise. When faced with a choice between stocks that pay a particular yield – and could lose value, and deposit accounts with a similar yield – which cannot lose value, the most conservative investors are likely to opt for the deposit accounts. As these conservative investors move cash out of dividend stocks like consumer staples, and into deposit accounts, the stock prices for this sector will likely decline sharply. We’ve been warning about this reach for yield unwind since our April alert, Don’t Touch That Blue Chip Dividend Stock! Looking at the daily chart for consumer staples below, we can see that the group has already started breaking down as investors anticipate higher interest rates. While consumer staples stocks have traditionally been a great source of stable income for investors, the current market environment makes this sector very dangerous. We’re encouraging investors to take profits in these stocks and avoid the area for the next several months. Once the sector trades lower and valuations are back to more attractive levels, it may be a great time to reinvest capital into this group. But for now, the “widow and orphan” stocks are some of the most dangerous investments in the market. Below is a list of the top stocks included in the consumer staples ETF as compiled by Morningstar. This is a good list to start with when reviewing your portfolio for exposure to consumer staples stocks. In addition to reducing exposure to consumer staples stocks, tactical traders may want to set up bearish trades to profit from a decline. Shorting shares of these stocks with a tight stop, or entering bearish spread trade with options are just two of the ways traders can profit from falling stock prices. In our next installment in this series, we’ll start looking at individual stocks in this group. In the meantime, we’d love to hear your thoughts on consumer staples. Please use the comment section below to let us know your thoughts on this group.

How To Choose Between VOO And SPY

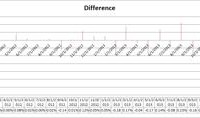
Summary The Vanguard S&P 500 ETF has a strong correlation to SPDR’s S&P 500 ETF. Despite the very strong correlation in returns, there is a clear way to pick which ETF is a better investment. The difference is more than expense ratios. The fund underperforming in one month regularly outperforms in the next using dividend adjusted close values. Investors in the Vanguard S&P 500 ETF (NYSEARCA: VOO ) have plenty of reasons to be happy with their investment. The fund tracks a reasonably stable portion of the U.S. economy and offers investors a lower expense ratio than a major competitor, the SPDR S&P 500 Trust ETF (NYSEARCA: SPY ). The ratio isn’t substantially lower, but the difference is meaningful if the investment horizon is long enough. For VOO the expense ratio is .05% and for SPY it is .09%. The difference should imply that VOO would outperform over the long term by increasing the compound annual growth rate by about .04%. The difference isn’t huge, but it does add up over time. The correlation Returns between the two ETFs have an extremely high correlation, over 99.9%. The strong correlation in returns gives investors reason to believe that the two ETFs should move almost perfectly in unison. However, there are occasionally meaningful differences in the share price of the two major ETFs and those differences result in opportunities for investors. Looking back I ran some regression on returns since the start of October 2010. Since then, the Vanguard S&P 500 ETF has largely mirrored the SPDR S&P 500 ETF. Both were up between 94.1% and 93.6% and the movements generally occur at almost precisely the same time. The interesting thing was when I decided to track the differences in the dividend adjusted closes for each month. The premise is that for each month I would look at the returns on VOO and subtract the returns on SPY. This gave me the difference in the percentage return for the month. I put together a chart to demonstrate, but the volume of data points may make it a little difficult to read. (click to enlarge) What investors should notice is that the bars are regularly trading direction. Not only do the bars swing back and forth, the longest bars going in any direction are precisely between two bars heading in the opposite direction. When the bars are fairly short, it provides little indication of which way the bars will move in the future. The theory My prediction upon glancing at the numbers was that we should expect to see serial negative correlation in the difference of the returns. In simpler words, we should expect the two ETFs to move together and treat any deviation from that connection as an error by the market. When one ETF has meaningfully outperformed the other in the previous month, the one with weaker performance should be purchased. I tested that by running a correlation between the difference for each month and the difference reported in the next month. If my theory was correct, there should be a negative correlation. The test showed a negative correlation of 35.7% (rounded). With a decent sample size, I’m comfortable taking that as confirmation. In my opinion, the deviations in the market value of these two ETFs can be used as a clear indication on which ETF investors should be buying if they are investing with a time frame of a few years. If the time frame is multiple decades If investors are planning to buy and hold the shares for a few decades, the difference in expense ratios should overwhelm the regression between the two ETFs and I would expect VOO to provide slightly superior returns over the next 20 or 30 years due to the difference in expense ratios. Conclusion Vanguard S&P 500 ETF is a great investment for keeping up with the S&P 500 over the long time. It offers a lower expense ratio than SPY and very similar returns. When the time frame is measured in months or only a couple of years, investors may want to look at the recent difference in returns and choose the ETF that has seen weaker share price performance since there is a very solid history of the differences in performance reversing over the following month. For investors that can trade VOO without commissions, the benefit of removing commissions could eliminate the short term advantages of investing in the fund with a weaker short term history. However, that depends entirely on the share volume trading hands. If there was a meaningful movement in price between the two ETFs, I would expect the weaker one on average to capable of outperforming by about .10% in the following month. For the investor contemplating investing in VOO and capable of trading it without commissions, the most attractive time to do so is when it has just fallen short of SPY. If we assume SPY is the most accurate gauge of the movement in the economy, then any time that VOO becomes cheaper relative to SPY is a time when the ETF is more attractive to purchase. It doesn’t matter if SPY moved up or down last month, it simply matters whether VOO underperformed SPY. Disclosure: The author has no positions in any stocks mentioned, and no plans to initiate any positions within the next 72 hours. (More…) The author wrote this article themselves, and it expresses their own opinions. The author is not receiving compensation for it (other than from Seeking Alpha). The author has no business relationship with any company whose stock is mentioned in this article. Additional disclosure: Information in this article represents the opinion of the analyst. All statements are represented as opinions, rather than facts, and should not be construed as advice to buy or sell a security. Ratings of “outperform” and “underperform” reflect the analyst’s estimation of a divergence between the market value for a security and the price that would be appropriate given the potential for risks and returns relative to other securities. The analyst does not know your particular objectives for returns or constraints upon investing. All investors are encouraged to do their own research before making any investment decision. Information is regularly obtained from Yahoo Finance, Google Finance, and SEC Database. If Yahoo, Google, or the SEC database contained faulty or old information it could be incorporated into my analysis.