Tag Archives: handle

SPY-TLT Universal Investment Strategy 20 Year Backtest

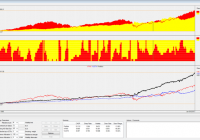
20 year strategy backtest using Vanguard VFINX/VUSTX index funds as a proxy for SPY/TLT. The strategy uses an adaptive SPY/TLT allocation, depending of the market environment. The strategy achieves 2x the return to risk ratio and a 5x smaller max drawdown than a buy and hold S&P 500 investment. In a previous article ” The SPY-TLT Universal Investment Strategy ” I presented a simple strategy which allowed to obtain an excellent return to risk ratio only by investing in variable allocations to the SPDR S&P 500 Trust ETF ( SPY) and the i Shares 20+ Year Treasury Bond ETF (NYSEARCA: TLT ) allocations. The allocation of the SPY/TLT pair is rebalanced monthly using a modified sharpe formula. For the new month, the strategy always uses the allocation ratio which achieved the highest modified sharpe ratio for a given lookback period. Here the algorithm uses a 72 day lookback period and a volatility factor of 2.5 in the modified sharpe formula: sharpe=72 day return/72 day standard deviation ^ 2.5. Several readers asked me now to present a longer backtest of this strategy. Using the Vanguard Five Hundred Index Fund Inv ( VFINX) and the Vanguard Long Term Treasury Fund Inv (MUTF: VUSTX ) as a proxy to the SPY/TLT ETFs, here is now a 20 year backtest for the UIS strategy. These index funds are only used to do the 20 year backtest. To run the strategy you would still invest using SPY and TLT. You can also use futures (ES/UB) or leveraged ETFs ( Direxion Daily S&P 500 Bull 3X Shares ETF ( SPXL)/ Direxion Daily 30-Year Treasury Bull 3x Shares ETF ( TMF) or Direxion Daily S&P 500 Bear 3X Shares ETF ( SPXS)/ Direxion Daily 30-Year Treasury Bear 3x Shares ETF ( TMV)) instead. This is explained in detail in my previous article. With these two Vanguard funds, this is now one of the rare strategies which can be easily backtested for such a long period. In general however, I think that it is much more important, how a strategy performed after 2008. The market has changed considerably during these last years, and if you would only invest in strategies which can be backtested 20 or more years, then you would have missed most of the investment opportunities of the recent years. For the backtest, I use our QuantTrader software. This software is written in C# and allows to backtest and optimize investment strategies using this sharp maximizing approach. You see the screenshot of the results below. The upper chart shows the VFINX/VUSTX performance. The middle chart shows the allocation with red=treasury and yellow=S&P500. If you look at this allocation, then you see that the market is in fact oscillating between “risk on” bull stock markets and “risk off” bear stock markets (= bull treasury market). Overall, you can say that for buy and hold investors, treasuries have been the better investment for the last 20 years. The sharpe ratio (return to risk) of the VUSTX treasury is 0.79, while the sharpe of the VFINX S&P500 fund is only 0.5. With VFINX/VUSTX combined, the strategy achieves a sharpe of 1.28, which is more than double the return to risk ratio of a stock market investment. This means, that instead of investing 100’000$ in the U.S. stock market, using leverage, you could invest 250’000$ in the UIS strategy. This way you would have the same risk, but you would get 20%-30% annual return. The strategy shows a very smooth equity line and the real max drawdown is well below 10%. The 11.68% drawdown peak measured in 2008 was in fact only an extreme mean-reversion reaction following a near 20% treasury up spike. The max drawdown is more than 5x smaller than a buy-and-hold stock market investment. Personally I think, this is in fact the biggest argument for such a strategy. All together, we had several major market correction like the 2000 tech bubble dot-com crisis, the 2001 9/11 attack, the 2003 Gulf war, the 2008 subprime crisis, the 2011 European sovereign debt crisis and lots of other smaller corrections. The UIS strategy always performed very well during these corrections. From 1995 to 2007, the UIS strategy had quite a stable 12% annual return. After 2008, the UIS return increased to 15% annually. The main reason for this improvement is the increased volatility and momentum factors present in the market. After the 55% correction of the U.S. stock market in 2008, VFINX had a lot to recover the last years. In fact, the normal average growth rate of the S&P 500 is about 9% and not 15% like it was during the last 5 years. The UIS strategy “likes” market corrections from time to time, because then the strategy can profit during the down market from treasuries going up and when the market goes up again, then the strategy can profit a second time from a higher stock market allocation. This way, the strategy can return more than each of the two single ETFs. If you want to check the monthly investments of this strategy, then you can download here the full backtest Excel file: 20 year performance log UIS VFINX VUSTX (click to enlarge) Source: Logical-invest.com

Why Long-Term Investor Over Short-Term

Long-term investing is delayed gratification, whilst short-term is income-orientated. The stock market has averaged 9% per year over the long term. Vanguard has a suitable ETF for long-term passive investors. Bearish signs on the S&P 500 and Gold in the short term, but Gold in the long term looks attractive from here. This is an important question to ask yourself before you invest capital into the markets. “Start with the end in mind” is a good question to ponder over your investment goals. Do you want to be active or passive? Do you want regular income or are you going to leave your money to compound over time? What about day trading? The answer to these questions is going to be different for everyone but they are definitely questions you should ask yourself before you start investing. Let’s discuss some long- and short-term set-ups at present so you can have a better idea on the strategy that suits your personality the best. So what’s your end goal here if you want a career in investing? Well there are 2 extremes. You can learn to become a compounding long-term giant like Warren Buffett or a day trader or even a high-frequency trader where your sole objective is daily income. Long-term investors do their due diligence on multiple companies, and usually hold onto their underlyings for at least 6 to 12 months, if not years, before thinking of liquidating. Day traders and short-term investors, on the other hand, mainly look at charts, moving averages, volatility and sentiment in order to predict short-term direction. Long-term investing brings many advantages. You are not glued to your screen everyday watching for every uptick. Professional investors’ “modus operandi” is to thoroughly research companies and then make their decisions accordingly. This is where the big gains are because you are effectively an insider. You know information about startups that the public doesn’t. If you want to be in this game full time (this being your career), I believe that is the end goal. Nevertheless, not everyone has that sort of time when starting out, so let’s take a look at the steps you could take to get to your end goal faster. Most investors are definitely passive, as there are constraints on their time. This is definitely the best way to start out. There are many vehicles such as (NYSEARCA: VTI ) that average between 8% and 9% before tax annually over the long term. It is very difficult to beat the market when starting out, so this is a good strategy for an investor starting out on their career. Compounding works over time in your favor, and if you start out with a sizeable balance and also add to it regularly, it can turn into a sizeable amount of capital after some time. Every “saver” should adopt this approach as it is extremely difficult to get rich on savings alone. In our 1% portfolio, we have many equities that we will not sell at a loss because we are adopting the above principle. Our chosen equities will at least match the returns mentioned above. Many investors talk about the 2008 crash and how equities lost 50% of their values. However, many quality blue chips recovered and now have much higher prices than 2007. Let’s take a look at 2 of our holdings in our portfolio, Kellogg (NYSE: K ) and Coca-Cola (NYSE: KO ). We are not putting stop losses on these underlyings. Take a look at charts below to see their action over the last 10 years. (click to enlarge) (click to enlarge) As you can see, both companies recovered after the 2008 crash and for good reason. Both companies are leaders in their industries and cash rich. Even when stocks were plummeting in 2008, these companies raised their dividends. Kellogg has now raised its dividend for 10 straight years, and Coca-Cola has done the same for 52 years straight! Both are now yielding just under 3% for shareholders, but the yield was far higher in 2008 as dividends and stock prices converged. These stocks should definitely at least match the stock market going forward. This is why we will never sell them at a loss, as we know they will recover over time . These types of stocks give you a buffer (support) through good fundamentals and increased dividends. Let’s look at Gold also over a 10-year period. Gold has definitely been in a bull run since 2000. Have a look at the chart below of (NYSEARCA: GLD ) (ETF that tracks the price of Gold) to confirm. (click to enlarge) The startling fact is that amidst all the doom and gloom surrounding Gold recently, the precious metal is still up almost 180% over the last 10 years, which beats the stock market by double. With all the easing measures that central banks are adopting at present, Gold should rise from here if the bankers can’t halt deflation in its tracks, so I see no reason for selling Gold now, assuming you are a long-term investor. Nevertheless, let’s now look at short-term outlooks for both the stock market and Gold. Obviously, if the stock market corrects, our selected underlyings will also correct and definitely the stock market is more overbought now than Gold (period of 3 to 5 years). Look at the chart of (NYSEARCA: SPY ) below. As you can see, the S&P has run through its 50-day moving average, but more importantly, the trend line from the October lows last year to the December and January lows have been broken. This should imply downward action in the stock market for the next month or so but the slide may be halted by the upcoming FOMC meeting, which takes place on the 29th of this month. These meetings have acted as support for the market in the past, so I wouldn’t be surprised if the meeting puts a temporary floor under the market yet again later this month. (click to enlarge) Gold in the short term doesn’t look that attractive either. The volume in (NYSEARCA: DUST ) has spiked (see chart). This is an inverse leveraged ETF (x3 in the mining sector), and usually gives good predictions about where the mining sector is going in the short term. (click to enlarge) Also, when you look at the chart of (NYSEARCA: GDX ), you see that the mining ETF has printed a bearish candle in the last few days and the RSI levels are rather high. (click to enlarge) So how do you want to invest?. Do you want to hold through the down moves or sell? (passive or active). You need to answer this question before you start investing. Neither one is right nor wrong but one thing is clear. If Gold goes to the stratosphere, the long-term Gold bulls who own low-cost ETFs or physical will do very well. They have less trading costs, less headaches about short-term movement in price and obviously more compounding of their capital. If you decide you want to be a short-term or swing trader, be willing to invest the time because you will really have to sharpen your technical skills before being able to beat passive investors, but it most certainly is possible. Also nobody talks about the time involved when trading short-term. Passive investors are using that time to make money in other areas or researching other companies. What’s that time worth to passive investors, another 2%, 3%, 5% annually? These are only questions you can answer… Personally, I like to combine both but I always try to veer towards being long-term and fundamentals. Invariably, this means that the income from my short-term investments varies a lot every month, as I give precedence to my long-term goals.

Adams Express Is Proof That Closed-End Funds Can Survive Big Dividends

Closed-end fund ADX has been around since 1929. It’s paid dividends continuously since 1935. Since 1997, it’s paid $18 out in distributions—more than $5 more than it’s share price on 1/1/97. Adams Express Company (NYSE: ADX ) is something of an outlier in the closed-end fund, or CEF, world. It was founded in 1929 and, unlike most of its peers, is a stand alone company without a parent. What’s most impressive, however, is that Adams Express has long paid large dividends to shareholders and lived to tell about it. Proof that closed-end funds can pay worthwhile dividends and not self liquidate. A buyout that started it all Adams traces its current form back to World War I. It had been in the business of moving parcels, but was essentially shut out of the local mail angle of that by the government and the United Postal Service. Then, during the War, its business moving parcels by rail was taken over by the government. While it received nothing when the Post Office put it out of business delivering mail, in return for its rail express business it received shares in a company called American Railway Express Company. After the war those shares would be sold to the major railroads, leaving Adams with a lot of cash and, well, no business. That was when Adams Express shifted gears and became a closed-end fund. Oddly enough, that change took place pretty much right before the 1929 market crash and start of the Great Depression. At that point, the CEF had around $73 million. Today , the fund’s value is in the area of $1.5 billion. It started paying dividends, meanwhile, in 1935 and has done so continuously ever since-including through the depths of the 2007 to 2009 “great recession.” One important difference between Adams Express and most other closed-end funds is that it really is a separate company. In fact, the CEO is also the fellow who heads up its research and investing efforts. Most closed-end funds don’t have this type of independence, with a sponsor company like Eaton Vance (NYSE: EV ) calling all the shots and being paid to manage the fund. The fund’s day to day managers, meanwhile, usually work for the sponsor or another asset manager hired by the sponsor. Apples and Oranges? So, in some ways, it isn’t fair to make a direct comparison between Adams Express and other closed-end funds. Although that comparison isn’t exactly apples and oranges, it could easily be like comparing a Red Delicious to a Granny Smith. They are both apples, for sure, but they are vastly different other than that. That said, one thing that Adams proves is that dividends and closed-end funds can go very well together over long, long periods of time. In fact, more than 75 years . And the numbers are pretty amazing when you do some simple math. ADX data by YCharts Between 1997 and 2014 , Adams Express paid out $18 a share in distributions. The CEF traded hands for around $13 a share on January 1, 1997. And while the price has gone through its share of ups and downs over that 18-year span, that’s $5 more in distributions per share than what you would have paid to buy a share at the start of the period. Recently, the shares have been trading hands at around $13.50. That’s a pretty impressive feat. How did it do that? The thing about Adams Express’ dividend that helps make this possible is that it’s variable. Over that 18-year period the distribution was as high as $1.85 (2000) and as low as $0.45 (2009). So there should be no expectation of a steady payout here. In fact, the relatively new policy of paying out 6% of net assets a year in distributions means the payment will vary with performance. Many closed-end funds today use a managed or level distribution policy that ensures a high yield. Investors seeking income like this and often jump aboard for the income without much consideration for anything else. However, overly high payouts can lead to a slow bleed of net assets to shareholders. A quicker bleed in bad years. For long-term investors that could be a problem and means distribution policy is one of the most important things to consider. While a variable policy can leave you short of cash in weak markets, it can also ensure your investments keep paying you down the road. Another thing about Adams that is unique is a very low expense ratio . At around 0.6%, it’s similar to some of the more exotic, perhaps esoteric, exchange traded funds. That’s pretty cheap and helps to boost performance over long periods. Expenses are another important issue to keep an eye on for long-term investors. Not a recommendation, but… This isn’t meant to be a recommendation of Adams Express (I’ll write a more formal review shortly). It is more to hold up an example of a closed-end fund that has paid shareholders well via distributions and hasn’t slowly liquidated itself. That slow bleed is one of the concerns I read about most frequently in comments to CEF articles. And while most CEFs aren’t made of the same stuff as Adams Express, this quirky old bird still proves an important point about closed-end funds and dividends.