Tag Archives: function

Materials ETF: XLB No. 8 Select Sector SPDR In 2014
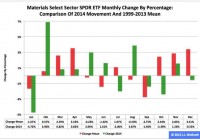
Summary The Materials exchange-traded fund finished eighth by return among the nine Select Sector SPDRs in 2014. The ETF was a winner in the first and second quarters, flattish in the third and a loser in the fourth. Seasonality analysis indicates its downward trajectory could continue in the first quarter. The Materials Select Sector SPDR ETF (NYSEARCA: XLB ) in 2014 ranked No. 8 by return among the Select Sector SPDRs that section the S&P 500 into nine subdivisions. On an adjusted closing daily share-price basis, XLB progressed to $48.58 from $45.33, a yield of $3.25, or 7.17 percent. Accordingly, it lagged its sibling, the Utilities Select Sector SPDR ETF (NYSEARCA: XLU ) and parent proxy, the SPDR S&P 500 Trust ETF (NYSEARCA: SPY ) by -21.57 and -6.29 percentage points, in that order. (XLB closed at $47.19 Wednesday.) XLB also ranked No. 8 among the sector SPDRs in the fourth quarter, when it behaved worse than XLU and SPY by -14.60 and -6.32 percentage points, respectively. And XLB ranked No. 6 among the sector SPDRs in December, when it performed worse than XLU and SPY by -4.13 and -0.30 percentage points, in that order. Figure 1: XLB Monthly Change, 2014 Vs. 1999-2013 Mean (click to enlarge) Source: This J.J.’s Risky Business chart is based on analyses of adjusted closing monthly share prices at Yahoo Finance . XLB behaved worse in 2014 as it did during its initial 15 full years of existence based on the monthly means calculated by employing data associated with that historical time frame (Figure 1). The same data set shows the average year’s weakest quarter was the third, with an absolutely large negative return, and its strongest quarter was the fourth, with an absolutely larger positive return. Inconsistent with this pattern last year, the ETF actually had a loss in Q4. Figure 2: XLB Monthly Change, 2014 Versus 1999-2013 Median (click to enlarge) Source: This J.J.’s Risky Business chart is based on analyses of adjusted closing monthly share prices at Yahoo Finance. XLB performed a little worse in 2014 than it did during its initial 15 full years of existence based on the monthly medians calculated by using data associated with that historical time frame (Figure 2). The same data set shows the average year’s weakest quarter was the third, with an absolutely large negative return, and its strongest quarter was the fourth, with an absolutely larger positive return. It also shows there is no historical statistical tendency for the ETF to explode in Q1. Figure 3: XLB’s Top 10 Holdings and P/E-G Ratios, Jan. 14 (click to enlarge) Note: The XLB holding-weight-by-percentage scale is on the left (green), and the company price/earnings-to-growth ratio scale is on the right (red). Source: This J.J.’s Risky Business chart is based on data at the XLB microsite and Yahoo Finance (both current as of Jan. 14). LyondellBasell Industries NV (NYSE: LYB ) aside, XLB’s top 10 holdings appear to range between fairly valued and overvalued (Figure 3). And these kinds of valuations seem unlikely to function as tailwinds for the ETF this quarter, even though the numbers on the S&P 500 materials sector reported by S&P Senior Index Analyst Howard Silverblatt Dec. 31 indicated the sector’s valuation is not superstretched, with its P/E-G ratio at 1.26. However, I suspect XLB will continue to be a laggard among the Select Sector SPDRs in Q1, mostly because of the bias divergence in monetary policy at major central banks around the world. On the one hand, the U.S. Federal Reserve is oriented toward tightening; on the other hand, the Bank of Japan, European Central Bank and People’s Bank of China are oriented toward loosening. This bias divergence has had important effects on currency-exchange rates, such as the one centered on the euro and U.S. dollar pair: The EUR/USD cross dipped from as high as $1.3992 May 8 to as low as $1.1753 Jan. 8, a drop of -$0.2239, or -16.00 percent. This change in EUR/USD and similar moves in other currency pairs could pressure earnings of U.S. companies in sectors with substantial international businesses. It is noteworthy the Fed announced the conclusion of asset purchases under its latest quantitative-easing program Oct. 29 and may announce the beginning of interest-rate hikes April 29. Its ending of purchases under its first two formal QE programs this century is associated with a correction and a bear market in large-capitalization equities, as evidenced by SPY’s falling -17.19 percent and -21.69 percent in 2010 and 2011, respectively. If one were to argue that this time is different, then I would have to wonder: Why? Disclaimer: The opinions expressed herein by the author do not constitute an investment recommendation, and they are unsuitable for employment in the making of investment decisions. The opinions expressed herein address only certain aspects of potential investment in any securities and cannot substitute for comprehensive investment analysis. The opinions expressed herein are based on an incomplete set of information, illustrative in nature, and limited in scope. In addition, the opinions expressed herein reflect the author’s best judgment as of the date of publication, and they are subject to change without notice.
3 Investments Jeffrey Gundlach Loves In 2015

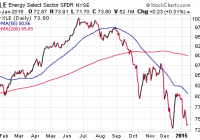
Summary This article summarizes Jeffrey Gundlach’s “2015 Market Outlook” webcast. He spoke favorably about the underlying fundamentals in the strong U.S. dollar despite its rapid ascent last year and how currency trends can be “persistent and long lived”. Gundlach also spoke favorably about gold as a flight to quality instrument. Yesterday I listened to Jeffrey Gundlach’s “2015 Market Outlook” webcast along with much of the financial community. Gundlach has certainly peaked in his notoriety as one of the most prestigious bond fund managers and continues to draw fascination for his timely insights into global economic machinations as well. For full disclosure: I have owned the DoubleLine Total Return Fund (MUTF: DBLTX ) for myself and my clients for many years now as well as various other Doubleline funds along the way. I have found Gundlach’s team focus on security selection, duration exposure, risk management, and overall total return to be a far more attractive value proposition than owning a passive index such as the iShares U.S. Total Bond Market ETF (NYSEARCA: AGG ). One of the themes that Gundlach noted throughout his call is that the U.S. consumer is focused on the positive impact of the oil space, while Wall Street has yet to fully embrace the impending negative aspects. He noted that currently 35% of the S&P 500 capital expenditures are represented in energy companies, of which there is a probability this spending could completely evaporate later this year. That could ultimately lead to employment cuts, potential bankruptcies for leveraged energy companies, and deeper impact across the high yield bond spectrum. The Energy Select Sector SPDR (NYSEARCA: XLE ) has certainly been pricing in some of those eventualities as it continues to decline with crude oil prices. Despite some modest rallies, XLE now stands at more than 25% off its 2014 high and recent probed down to new lows as angst sets in. The one thing I have noted recently is how much buying has been on throughout the energy complex since the decline began. At this juncture you would typically expect widespread distribution rather than accumulation in energy ETFs. He also spoke favorably about the underlying fundamentals in the strong U.S. dollar despite its rapid ascent last year and how currency trends can be “persistent and long lived”. However, he candidly stated that “I know it’s a crowded trade. I’m as uncomfortable as everybody else.” The PowerShares U.S. Dollar Bullish Fund (NYSEARCA: UUP ) has been a big mover as declines in the euro and Japanese yen continue to fuel a flight to the dollar. The overarching themes of lackluster growth and quantitative easing efforts in these foreign developed countries make the U.S. dollar, and concomitantly U.S. treasuries, an attractive trade for overseas dollars. Gundlach also spoke favorably about gold as a flight to quality instrument. He thinks that gold will move higher as the stress to the financial system from the repercussions of oil deflation takes hold. We have already seen an uptick in the SPDR Gold Shares ETF (NYSEARCA: GLD ) since the beginning of 2015 as it comes off multiple years of heavy declines. This sector certainly bears watching as volatility in both stocks and commodities may favor investors seeking out hard assets with non-correlated returns as a hedge against other investments. On interest rates, Gundlach noted how far off economists were in predicting the outcome of the 10-Year Treasury note yield at the end of 2014. He believes that the trend in higher bond prices (lower bond yields) will continue in the first half of this year and will probably overshoot most investors’ expectations. The strong price trend in the iShares 7-10 Year Treasury Bond ETF (NYSEARCA: IEF ) has continued to stretch further than many believed possible, and has gone almost vertical since the beginning of 2015. On a relative basis the U.S. 10-Year Yield near 1.80% is still far more attractive than other developed nations in Europe and Japan. There is obviously no concern right now for a rate hike scenario being priced into the market. Instead, investors are focusing on sheltering their portfolio from low global yields and a volatile stock environment. Other bullets of caution worth mentioning: Gundlach did not speak favorably about bitcoin and noted it was virtually the worst performing asset class of 2014. (See what I did there with “virtually”?) The stock market has been positive for the last 6 years straight (2009-2014). Stocks never been up 7 years in a row since 1871. He still feel that Treasury inflation protected securities ( OTC:TIPS ) are for losers because near-term inflation expectations are actually pointing towards negative trends. He did note that they are cheap on a relative basis, but the overriding argument to own them is flawed in this market. Avoid the iShares TIPS Bond ETF (NYSEARCA: TIP ) for the time being. He is “afraid of mall REITs” due to more retail sales moving online and shrinking need for conventional shopping centers. He noted that “It’s a little late to buy the Shanghai (China)” after last year’s run and that you probably don’t want to own European stocks or bonds right now. Also beware of leveraged ETFs with respect to compounding and tracking error over time. He noted the big decline in the DirexionShares Daily Gold Miners Bear 3x Shares (NYSEARCA: DUST ) for 2014, despite the fact that the Market Vectors Gold Miners ETF (NYSEARCA: GDX ) was down heavily last year as well. The Bottom Line No one man knows the fate of the markets and most will probably take these comments with a grain of salt. However, those that take a wider macro view in their investment analysis may be intrigued by some of the correlations that were noted in this presentation. Many of the observations Gundlach made in his monologue mirror our own thoughts on the market at this juncture. Our most recent January 2015 client memo outlined several salient points on interest rates, volatility, and areas of perceived value as well.

A Value Approach To Rebalancing Out Of U.S. Stocks

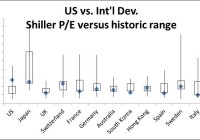
Summary I will present an approach to use Shiller P/E to value-adjust portfolio weights when rebalancing for 2015. Interestingly, of 13 developed and 12 emerging market countries evaluated, the U.S. is the only country currently in the top quartile of its historic P/E range. With the exceptions of the U.S., Switzerland, South Africa and Thailand, every developed and emerging market country’s P/E ratio is currently below its historic median. 2014 was unexpectedly a solid year for U.S. equities. Many predicted that the multi-year bull market would not continue, but yet the Vanguard Total Stock Market ETF (NYSEARCA: VTI ) managed a 12.6% total return. The same fortune could not be said about the Vanguard FTSE Developed Markets ETF (NYSEARCA: VEA ) (-5.7%) or the Vanguard FTSE Emerging Markets ETF (NYSEARCA: VWO ) (+0.6%). In rebalancing, I have in years past kept things simple and diligently rebalanced my stock portfolio to the same target weights (note this is not my entire portfolio – I also hold bonds, REITs, and individual value stocks): Index Stocks Wt. Total U.S. 50% International Developed 25% Emerging Market 25% The S&P 500, as mentioned in my previous article on market valuation, is ridiculously high. Using a few valuation metrics, history would suggest the U.S. market is due for a correction. I will certainly reduce my exposure to U.S. stocks, as I would normally in rebalancing. However, based on the current relative level of the U.S. market, I consider the traditional rebalancing approach of reducing my U.S. total stock position down to 50% insufficient if not foolish. I have done enough comparisons over time and cross-sectionally to sit idle. Instead I want to reduce my U.S. allocation further, while maintaining the same stock exposure. In this article, I will present an approach to use Shiller P/E to adjust rebalancing weights for value in 2015. My intent is NOT to actively manage my ETF portfolio, but instead to set periodic weights (once a year) based on market valuations and rebalance to them. I encourage your feedback on this disciplined simple mix of passive rebalancing with value investing. Country Price-Earnings ratio boxplots I credit Research Affiliates LLC for providing the historic ranges of Shiller Price-Earnings ratios for developed and emerging market countries (all countries have at least 19 years of data). The chart below shows the range of P/E ratios for U.S. versus International Developed countries in a boxplot with the current value in blue, the line representing the lower 25% and upper 25%, and the box representing the middle 50%. The countries shown represent 90.1% of the Vanguard FTSE Developed Markets ETF. Interestingly, only the U.S. is in the top quartile of its historic range. Also note in absolute level, it has the highest P/E ratio. The U.S., at 27.1 times earnings is 2.2 times higher than the next highest developed country, Japan. Since I do not have the entire distribution to calculate the current percentiles (and create an average percentile), I instead rate each country with a number 1 through 4 that represents which historic quartile its current P/E ratio stands in (from top to bottom). Thus, the U.S. scores a 1 and the portfolio weighted average score for the International Developed countries is 3.32. (click to enlarge) Next I will show the U.S. versus Emerging Market P/E ratio boxplots. Note, these countries represent 94% of the Vanguard Emerging Markets Stock Index ETF. Once again the U.S. is alone in the 4th quartile of its historic range and is has a higher P/E ratio greater than the emerging market country with the highest P/E ratio (Mexico) by 6 times earnings. Using the same quartile scoring approach as the U.S. and International Developed countries, the Emerging Market average score is 3.26. (click to enlarge) Country P/E deviations from median Next, I measure the percent deviation from the historic medians for each country. I omitted adding medians on the boxplots to avoid cluttering them. The U.S. P/E ratio is currently 70% above its historic median. With the exceptions of Switzerland, South Africa and Thailand, every other Developed and Emerging Market country is currently below its historic median. Also note, these three are only modestly above their medians (within 20%). Brazil, Russia, and Italy are all 35% below their median P/E ratios or lower. (click to enlarge) (click to enlarge) Conclusion: New Portfolio Weights Using the three quartile scores, I recalculate my new portfolio weights by ranking them with adjustments of (-10%, 0, and +10%). Since the International Developed and Emerging Market scores are so close, I give them both weight increases: Stock 2014 weights Avg. P/E Quartile Weight adjustment 2015 weights Total U.S. 50% 1.00 -10% 40% International Developed 25% 3.32 +5% 30% Emerging Market 25% 3.26 +5% 30% Total 100% 7.58 0% 100%