Scalper1 News
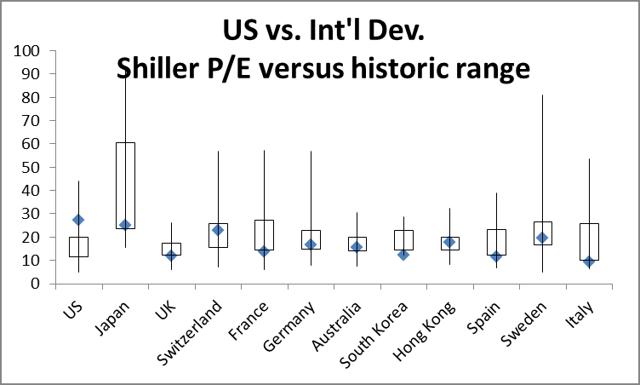
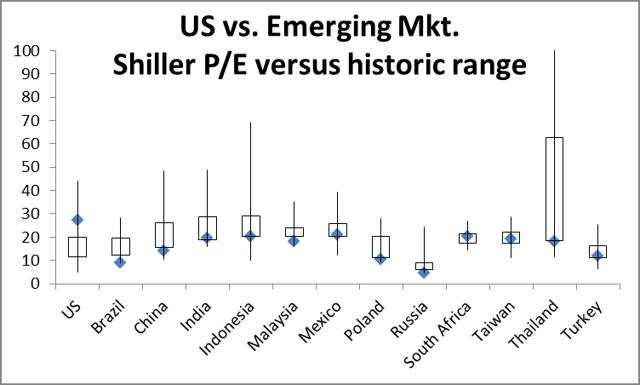
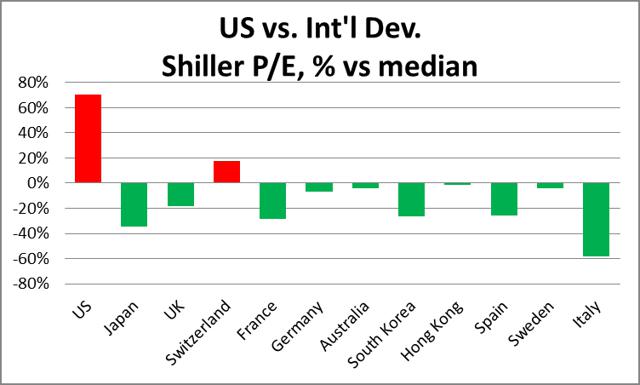
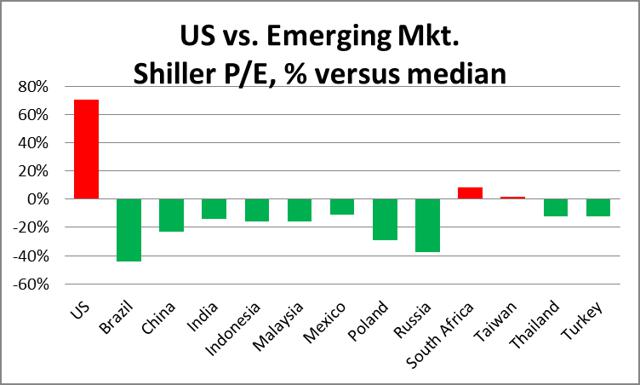 Summary I will present an approach to use Shiller P/E to value-adjust portfolio weights when rebalancing for 2015. Interestingly, of 13 developed and 12 emerging market countries evaluated, the U.S. is the only country currently in the top quartile of its historic P/E range. With the exceptions of the U.S., Switzerland, South Africa and Thailand, every developed and emerging market country’s P/E ratio is currently below its historic median. 2014 was unexpectedly a solid year for U.S. equities. Many predicted that the multi-year bull market would not continue, but yet the Vanguard Total Stock Market ETF (NYSEARCA: VTI ) managed a 12.6% total return. The same fortune could not be said about the Vanguard FTSE Developed Markets ETF (NYSEARCA: VEA ) (-5.7%) or the Vanguard FTSE Emerging Markets ETF (NYSEARCA: VWO ) (+0.6%). In rebalancing, I have in years past kept things simple and diligently rebalanced my stock portfolio to the same target weights (note this is not my entire portfolio – I also hold bonds, REITs, and individual value stocks): Index Stocks Wt. Total U.S. 50% International Developed 25% Emerging Market 25% The S&P 500, as mentioned in my previous article on market valuation, is ridiculously high. Using a few valuation metrics, history would suggest the U.S. market is due for a correction. I will certainly reduce my exposure to U.S. stocks, as I would normally in rebalancing. However, based on the current relative level of the U.S. market, I consider the traditional rebalancing approach of reducing my U.S. total stock position down to 50% insufficient if not foolish. I have done enough comparisons over time and cross-sectionally to sit idle. Instead I want to reduce my U.S. allocation further, while maintaining the same stock exposure. In this article, I will present an approach to use Shiller P/E to adjust rebalancing weights for value in 2015. My intent is NOT to actively manage my ETF portfolio, but instead to set periodic weights (once a year) based on market valuations and rebalance to them. I encourage your feedback on this disciplined simple mix of passive rebalancing with value investing. Country Price-Earnings ratio boxplots I credit Research Affiliates LLC for providing the historic ranges of Shiller Price-Earnings ratios for developed and emerging market countries (all countries have at least 19 years of data). The chart below shows the range of P/E ratios for U.S. versus International Developed countries in a boxplot with the current value in blue, the line representing the lower 25% and upper 25%, and the box representing the middle 50%. The countries shown represent 90.1% of the Vanguard FTSE Developed Markets ETF. Interestingly, only the U.S. is in the top quartile of its historic range. Also note in absolute level, it has the highest P/E ratio. The U.S., at 27.1 times earnings is 2.2 times higher than the next highest developed country, Japan. Since I do not have the entire distribution to calculate the current percentiles (and create an average percentile), I instead rate each country with a number 1 through 4 that represents which historic quartile its current P/E ratio stands in (from top to bottom). Thus, the U.S. scores a 1 and the portfolio weighted average score for the International Developed countries is 3.32. (click to enlarge) Next I will show the U.S. versus Emerging Market P/E ratio boxplots. Note, these countries represent 94% of the Vanguard Emerging Markets Stock Index ETF. Once again the U.S. is alone in the 4th quartile of its historic range and is has a higher P/E ratio greater than the emerging market country with the highest P/E ratio (Mexico) by 6 times earnings. Using the same quartile scoring approach as the U.S. and International Developed countries, the Emerging Market average score is 3.26. (click to enlarge) Country P/E deviations from median Next, I measure the percent deviation from the historic medians for each country. I omitted adding medians on the boxplots to avoid cluttering them. The U.S. P/E ratio is currently 70% above its historic median. With the exceptions of Switzerland, South Africa and Thailand, every other Developed and Emerging Market country is currently below its historic median. Also note, these three are only modestly above their medians (within 20%). Brazil, Russia, and Italy are all 35% below their median P/E ratios or lower. (click to enlarge) (click to enlarge) Conclusion: New Portfolio Weights Using the three quartile scores, I recalculate my new portfolio weights by ranking them with adjustments of (-10%, 0, and +10%). Since the International Developed and Emerging Market scores are so close, I give them both weight increases: Stock 2014 weights Avg. P/E Quartile Weight adjustment 2015 weights Total U.S. 50% 1.00 -10% 40% International Developed 25% 3.32 +5% 30% Emerging Market 25% 3.26 +5% 30% Total 100% 7.58 0% 100% Scalper1 News
Scalper1 News