Tag Archives: function

Industrial Metals ETFs Investing 101

A stronger greenback, falling oil prices and an economic slowdown in China have lately emerged as major headwinds for the global metal industry. Moreover, excess supply has been a perennial problem for the industry. Iron ore has lost 50% of its value in 2014, the biggest annual decline in at least five years, impacted by excessive inventory along with abundant supply and slow economic growth in China. Global steel production has also been weak, mainly dragged down by a slowdown in China’s output, which affected demand for iron ore, its main ingredient. The low prices have squeezed margins of iron producers leading to the cancellation or suspension of mining projects. Moreover, softness in China amid an oversupply had led to a decline in copper prices in 2014. Copper prices further dipped to a four-year low in November end to $2.861 per pound on falling oil prices. Overall, copper fared the worst among all industrial metals, with prices declining 11% through the year. On the other hand, during 2014, the global aluminum industry went through a substantial change to correct the supply-demand imbalance. Major aluminum producers like Rusal and Alcoa Inc. (NYSE: AA ) cut their aluminum production, resulting in tightening of aluminum supply, which sent the metal’s prices northward. However, in the last months of 2014, falling oil prices and weak industrial data from China have led to a drop in aluminum prices. Aluminum is an energy intensive industry, with energy costs accounting for nearly 30% of the total cost of production. Falling oil prices tend to have a deflationary effect on aluminum. Nevertheless, aluminum prices ended the year with a 13% gain, higher than January levels. What’s in Store? Iron : The threat of oversupply looms large over the iron ore industry as major producers, Rio Tinto, BHP Billiton Ltd. (NYSE: BHP ), Vale S.A. (NYSE: VALE ) and Fortescue Metals Group Ltd. ( OTCQX:FSUGY ), continue to ramp up production. Australia, the world’s top exporter, cut its iron ore price estimate for next year by 33% as the surging output will outpace Chinese demand growth, leading to a supply glut. Global apparent steel use is expected to grow 2% in 2015 to reach 1,594 Mt. Softness in steel demand in China will continue to be a drag on the same. China is the largest consumer of iron ore, accounting for around 60% of the global seaborne market. Thus, the mismatch between the excess supply and demand for iron ore will keep iron ore prices subdued in the near term. Aluminum : Aluminum consumption is expected to improve on a global basis spurred by the automotive and packaging industries, its key consumer markets. The airline industry is also expected to boost demand for the metal. Following China, which accounts for over 40% of the global aluminum consumption, India appears promising given its current low level of aluminum consumption and high urban population growth. With demand remaining strong and the industry pulling in the reins on supply, the aluminum market is likely to witness deficits for a prolonged period. This will support high aluminum prices going forward. Copper : The copper market seems to be shifting into supply surplus. In the near term, prices will be influenced by economic activity in the U.S. and other industrialized countries. Revival in demand from China will also act as a catalyst. Notwithstanding the current volatility in prices, we have a long-term bullish stance on copper, supported by its widespread use in transportation, manufacturing and construction, limited supplies from existing mines and the absence of new significant development projects. To Sum Up A revival in the Chinese economy on the back of policy support and correction of the supply-demand imbalance will be instrumental in driving growth in the industry, while projected earnings growth for 2015 instills optimism in the same. ETFs to Tap the Sector An ETF approach can help spread out assets among a variety of companies and reduce company-specific risk at a very low cost. There are currently two ETFs available to play this sector. SPDR S&P Metals & Mining ETF (NYSEARCA: XME ) Launched in Jun 2006, XME seeks to replicate the S&P Metals and Mining Select Industry Index. The S&P Metals & Mining Select Industry Index represents the metals and mining sub-industry portion of the S&P Total Market Index. The fund currently has AUM of $390.4 million. XME has a trading volume of roughly 1.6 million shares a day, suggesting little or no extra cost in the form of bid/ask spreads. The ETF is a low-cost choice, charging a net expense ratio of 35 basis points a year, while the dividend yield is 2.30% currently. The fund currently holds 35 stocks in its basket, with only 38.12% of assets in the top 10 holdings. From a commodities perspective, the product is heavily weighted toward steel with 41% sector weightage, followed by coal and consumable fuels (17%), diversified metal and mining (13%), aluminum (11%), silver (7%), gold (7%) and precious metals and minerals (4%). Among individual holdings, top stocks in the ETF include Hecla Mining Co. (NYSE: HL ), TimkenSteel Corporation (NYSE: TMST ) and Compass Minerals International Inc. (NYSE: CMP ) with asset allocation of 4.19%, 4.14% and 3.88%, respectively. iShares MSCI Global Metals & Mining Producers ETF (NYSEARCA: PICK ) The ETF seeks to match the price and yield performance of MSCI ACWI Select Metals & Mining Producers Ex Gold & Silver Investable Market Index. This index measures the equity performance of companies in both developed and emerging markets that are primarily involved in the extraction and production of diversified metals, aluminum, steel and precious metals and minerals, excluding gold and silver. Launched in Jan 2012, the fund has so far attracted AUM of $158 million. It has a trading volume of roughly 16,257 shares a day. The ETF is currently charging a net expense ratio of 39 basis points a year, with a dividend yield of 2.91%. The fund currently holds 209 stocks with 98% sector weightage toward basic materials. The fund allocates nearly 50% of the assets in the top 10 firms, which suggests that company-specific risk is somewhat high, as the top 10 holdings dominate half of the returns. Among individual holdings, top three stocks in the ETF include BHP Billiton Limited ( BHP ), Rio Tinto plc (NYSE: RIO ) and Glencore Plc (GLEN.L) with asset allocation of 10.81%, 8.4% and 6.76%, respectively. The fund is widely diversified across various countries, and Australia tops the list, holding 24.7% of the fund, followed by the United States (10.9%) and United Kingdom (9.96%). These three nations make up for nearly 46% of the assets.
Why Lower Inflation In India Is A Good Sign For International Investors

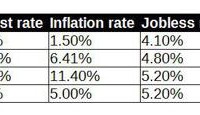
With lower inflation in India than previous years, HSBC forecasts the Indian rupee will remain highly stable this year, reducing exchange rate risk for investors. The Sensex stock market index has vastly outperformed that of Brazil, China and Russia – India’s stock market offers very attractive growth prospects. As an English-speaking country and a centre of technology worldwide, I believe India is at a distinct competitive advantage relative to its peers. Of all the four BRIC economies, I believe that India in particular has the potential to become the most powerful emerging market in the world by 2040. The country has never been over-reliant on manufacturing to sustain economic growth – India’s English speaking workforce along with the country’s status as a major technology give its economy a distinct advantage compared to that of Brazil, China and Russia. In particular, with India now set to meet inflation targets, this could mean very good news for international investors looking to get in on the India growth story. In comparing inflation rates across the BRIC economies, we can see that China has the lowest inflation rate currently at 1.50%, with Russia having the highest inflation rate at 11.40%. India’s inflation rate stands at 5.00%. Inflation is clearly an important consideration for international investors. As an American investor (or a European one, in my case), inflation has a direct impact on exchange rates – higher inflation typically results in a lower exchange rate as consumers stop spending due to higher prices. If this is the case, then a weakening Rupee means that our investment is worth less in dollars or euros. (click to enlarge) (click to enlarge) (click to enlarge) (click to enlarge) (click to enlarge) Sources: Trading Economics In terms of inflation rates, India has been successful in bringing inflation down from a previous rate of 8% in 2012. All else being equal, China would appear to look more favorable as a lower rate of inflation would not have as great an impact on investment value. However, deflation is currently more of a concern in China and this could also lead to exchange rate risks for international investors. Moreover, we can see that of the four emerging stock market indexes, the Indian Sensex Index has vastly outperformed those of China, Brazil and Russia: (click to enlarge) Source: Yahoo Finance Additionally, HSBC projects that the Indian rupee will continue to maintain strength, as lower oil prices will continue to lead to improvements in current account and inflation targets. HSBC reports that the rupee is expected to oscillate between 62.5 and 63 to the dollar this year, which should lead to a high degree of exchange rate stability for international investors. I expect that the long-term outlook for India’s stock market will remain positive due to effective management of inflation and strong fundamentals – stable exchange rates and inflation management means that the Sensex is likely to experience less volatility than that of other emerging markets. In conclusion, India’s use of effective monetary policy in reducing inflation to sustainable levels is clearly working. This is especially significant to international investors who are looking for stable returns yet vibrant growth. Additionally, given that the Sensex has vastly outperformed the stock indexes of the other BRIC economies, I am highly optimistic on India’s growth story going forward. Now that you’ve read this, are you Bullish or Bearish on ? Bullish Bearish Sentiment on ( ) Thanks for sharing your thoughts. Why are you ? Submit & View Results Skip to results » Share this article with a colleague

Middlesex Water: 42 Years Of Dividend Growth

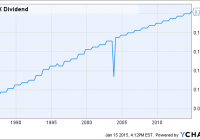
The shares currently sport a yield of about 3.5%. Utilities are notorious for being a great defensive play. Estimates for 2015 point to continued strong growth. Middlesex Water (NASDAQ: MSEX ) is a lightly followed water utility company based in New Jersey. The company operates in NJ as well as a couple of the surrounding states providing water related services. I found Middlesex while looking for attractive yields that are sustainable. Middlesex most definitely meets both of those traits. The company is worth a deeper look and at least an add to a watchlist. So the obvious first, the yield is nice at 3.5%. The company has had dividend growth for the past 42 years according to Dividend.com , most recently announcing an increase this past November. This increase puts the annual dividend at 77 cents a share with a current payout ratio of about 70%. While this may seem a bit high I don’t believe with a utility company like Middlesex it is something to be concerned with especially with the history of payments the company has. Below is the chart of the quarterly dividend growth since the late ’80s. Clearly other than the one disruption, which was for one quarter, there is a consistent uptrend. MSEX Dividend data by YCharts The company’s growth in general looks pretty as well. Both revenue and earnings have seen nice increases over the past few years and this trend also looks to be continuing. Year Revenue EPS 2013 $114.85M $1.03 2014 $117.29M(Est) $1.12 2015 $121.77M(Est) $1.19 (Sources for data and estimates: FT.com ) Using the estimates we see between 2013 and 2015 revenue is expected to increase another 6%, and EPS are expected to rise another 15.5%. EPS in 2015 of $1.19 would point to a payout ratio close to 64%, which means it will obviously practical for the dividend to be increased again. The great part about Middlesex is the fact that it is a great defensive play. There has been a crazy amount of noise that we are fast approaching a bear market with many companies way overvalued. I can’t argue with that last part. There are plenty of companies in this market overvalued. I also can’t say if there is a bear market coming or if there will just be a short-term correction. I do know that history tells us whatever the economic environment is Middlesex still performs well. The market has been up and down dozen of times in the past 42 years. Middlesex was still able to increase its dividend all those years. The fact is that water and water-related services will never go out of style. The barriers to entry are high so Middlesex doesn’t need to be overly concerned about competition as well. For a company that has done business since 1897 I don’t foresee any major problems anytime soon. In conclusion, I think Middlesex is a great play in a potentially rocky market. The yield is attractive at these levels and if the shares drop back a little more I think it would be a extremely good opportunity to pick some up. This year the company will celebrate its 118th birthday and likely increase its dividend for a 43rd year. Additional disclosure: Always do your own research before investing. Now that you’ve read this, are you Bullish or Bearish on ? Bullish Bearish Sentiment on ( ) Thanks for sharing your thoughts. Why are you ? Submit & View Results Skip to results » Share this article with a colleague