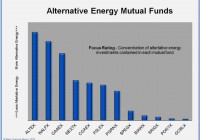
Summary There is a wide range of how focused the different green mutual funds are on alternative energy. Some stocks that a mutual fund may hold are easy to classify as alternative energy companies, others are not. Mutual Funds with the greatest alternative energy focus are ALTEX, NALFX and GAAEX. Not all alternative energy mutual funds are created equal. In a recent interview with the Wall Street Journal , a reporter asked me which alternative energy mutual funds were the most focused on renewables, noting that many mutual funds hold non-energy related companies such as Apple (NASDAQ: AAPL ), PepsiCo (NYSE: PEP ) and Google (NASDAQ: GOOG ). The answer to this question is not as straight forward as one might think. This article sorts out which mutual funds are truly invested in the dynamic and growing green energy sector, and which ones are more peripheral. Greener Than Thou-Revealing How Much a Mutual Fund is Focused on Alternative Energy Despite the desire of many investors to keep their portfolios clean of polluting investments, there is no perfectly pure alternative energy mutual fund. There is, however, a wide range of how focused the different green mutual funds are on alternative energy. Finding out which mutual funds have the highest concentration of alternative energy investments takes a multipronged approach. First, the Roen Financial Report scrutinizes the prospectus of each fund to see if its principles align with alternative energy investment goals. Second, for each company that the mutual fund holds, the annual report and financial filings are thoroughly examined to determine exactly how much of a company’s operations are related to the various green sectors that the Roen Financial Report covers – energy efficiency, environmental * , fuel alternatives, smart grid, solar and wind. Sometimes it is easy to tell whether a mutual fund holds stocks that are in one or more of the alternative energy sectors, but in other cases it is not so obvious. Clearly, pure play companies like First Solar, Inc (NASDAQ: FSLR ), Renewable Energy Group Inc (NASDAQ: REGI ) and SolarCity Corp (NASDAQ: SCTY ) are stocks that alternative energy investors are seeking. There are other companies, though, that have alternative energy products and services as part of their business model, but those operations are not the company’s bread-and-butter. For example, Johnson Controls (NYSE: JCI ) is a large industrial conglomerate that has two business units which address alternative energy themes -building efficiency and renewable power solutions. I estimate that alternative energy accounts for perhaps half of JCI’s revenues. Interestingly, shares of JCI are owned by 8 out of 12 alternative energy mutual funds, more than any other single company. Another example of a company with partial alternative energy operations is Valmont Industries (NYSE: VMI ). Valmont manufactures support towers for wind turbines, anemometers, power line transmission, mass transit poles, lighting and related structures. This company cannot be ignored-its contribution is critical to the infrastructure needed to support utility-scale solar, wind and smart grid projects that will continue to be built over the coming decades. However, my analysis attributes an estimated 15% of Valmont’s current earnings are a result of alternative energy projects. Google is another company that blurs into alternative energy, though it is obviously not its main business. Google realizes that it is basically an electricity-based service-no electricity, no Google. Because of this, Google has made a significant commitment to moving toward a more clean and sustainable electric supply. Google has moved on this in no small way, having invested in over $1.5 billion in wind and solar projects . In order to simplify the analysis of how much of a stocks business relates to alternative energy, only the stocks needed to reach at least 50% of a fund’s weighted holdings were included (or at a minimum, the fund’s top 10 holdings). Also, two mutual funds that the Roen Financial Report tracks were left out of the rating system, Allianz RCM Global Water A (MUTF: AWTAX ) and Calvert Green Bond A (MUTF: CGAFX ). AWATX invests in stocks and securities engaged in water-related activities, a sector related to green energy but with more of an environmental focus. Calvert Green Bond is another good choice for green investors, but is a different kind of animal than a stock fund, so it is hard to make an apples-to-apples comparison. Its prospectus states that investments include: …securities of companies that develop or provide products or services that address environmental solutions and/or support efforts to reduce their own environmental footprint; bonds that support environmental projects; structured securities that are collateralized by assets supporting environmental themes; and securities that, in the opinion of the Fund’s Advisor, have no more than a negligible direct environmental impact, which may include securities issued by the U.S. government or its agencies, and U.S. government-sponsored entities. The Greenest Alternative Energy Mutual Funds (click to enlarge) Three funds clearly top the list of having the greatest alternative energy focus: Firsthand Alternative Energy (MUTF: ALTEX ), New Alternatives (MUTF: NALFX ) and Guinness Atkinson Alternative Energy (MUTF: GAAEX ). These funds have a high concentration of alternative energy investments, and strongly focused investment principles. Firsthand Alternative Energy Five of Firsthand Alternative Energy’s top 10 weighted holdings are pure play companies such as First Solar , Sun Power (NASDAQ: SPWR ) and Solar City . Firsthand Alternative Energy is very specific in their prospectus, stating that they: …invest at least 80% of the Fund’s assets in alternative energy and alternative energy technology companies, both U.S. and international. Alternative energy currently includes energy generated through solar, hydrogen, wind, geothermal, hydroelectric, tidal, biofuel, and biomass. Alternative energy technologies currently include, but are not limited to, technologies that enable energies to be tapped, stored, or transported, such as fuel cells; services or technologies that conserve or enable more efficient utilization of energy; and technologies that help minimize harmful emissions from existing energy sources, such as helping reduce carbon emissions. It is important to note that ALTEX is the smallest of all alternative energy funds that the Roen Financial Report tracks, and we give this fund a low overall investment rank. New Alternatives New Alternatives Fund also has a very good concentration of alternative energy investments. The top six of its holdings are 100% pure play alternative energy companies. Additionally, the top 50% of its weighted portfolio is estimated to be over 75% involved in alternative energy. The investment objective of the fund is not the strongest of all alternative energy funds, but it is very specific: At least 25% of the Fund’s total assets will be invested in equity securities of companies in the alternative energy industry. ‘Alternative Energy’ means the production and conservation of energy in a manner that reduces pollution and harm to the environment, particularly when compared to conventional coal, oil or nuclear energy… The Advisor also considers the perceived prospects for the company and its industry, with concern for economic, political and social conditions at the time. In addition the Advisor considers its expectations for the investment based on, among other things, the company’s technological and management strength. Guinness Atkinson Alternative Energy GAAEX has a very strong concentration of alternative energy companies in its portfolio. When looking at the top two-thirds of its holdings, about 90% of those investments are involved in green energy production. Guinness Atkinson Alternative Energy also has one of the tightest investment principles guiding the fund: The Alternative Energy Fund invests at least 80% of its net assets in equity securities of alternative energy companies (both U.S. and non-U.S.). Alternative energy companies include, but are not limited to companies that generate power through solar, wind, hydroelectric, tidal wave, geothermal, biomass or biofuels and the various companies that provide the equipment and technologies that enable these sources to be tapped, used, stored or transported, including companies that create, facilitate or improve technologies that conserve or enable more efficient use of energy. Mutual Funds With a Lesser Alternative Energy Focus Funds that the Roen Financial Report rate as having the least alternative energy stocks are Gabelli SRI Green AAA (MUTF: SRIGX ), Portfolio 21 R (MUTF: PORTX ) and Green Century Balanced Fund (MUTF: GCBLX ). Gabelli SRI AAA Prior to last year, Gabelli SRI AAA had more of an alternative energy focus (its previous name was The Gabelli SRI Green Fund), but is now a social screened fund. It does, however, include some alternative energy holdings, such as JCI and VMI. Its investment objectives show that SRIGX has more of an exclusionary screen than a proactive green energy focus: Pursuant to the guidelines, the Fund will not invest in the top 50 defense/weapons contractors or in companies that derive more than 5% of their revenues from the following areas: tobacco, alcohol, gaming, defense/weapons production, and companies involved in the manufacture of abortion related products. Portfolio 21 R PORTX is an environmentally focused fund, which also has a broader social charge. Fewer than expected of its holdings, though, have an alternative energy focus. Only about one-third of its portfolio comprises companies that have a hand in alternative energy sectors. Its prospectus states that: The Advisor believes that the best long-term investments are found in companies with above-average financial characteristics and growth potential that also excel at managing environmental risks and opportunities and societal impact… The Advisor considers a company’s position on various factors such as ecological limits, environmental stewardship, environmental strategies, stance on human rights and equality, societal impact as well as its corporate governance practices. Green Century Balanced Fund Green Century Balanced is a mutual fund that invests in environmentally responsible and sustainable companies, and those not directly in the fossil fuel business. Even though its prospectus is very specific about including companies that have environmental goods and services, very few of the top weighted stocks in its portfolio work in green energy. Instead, many of its top holdings are in technology, health care and financial services. Despite this fact, GCBLX does have a detailed and relevant investment objective: The Fund invests primarily in the stocks and bonds of environmentally responsible and sustainable U.S. companies…whose primary business involves the provision of an environmentally sound good or service, such as appropriate technology for sustainable agriculture, renewable energy, energy efficiency, water treatment and conservation, air pollution control, pollution prevention, recycling technologies, or other effective remedies for existing environmental problems. The Fund also invests in companies whose primary business is not solving environmental problems but which conduct their business in an environmentally responsible manner. Such companies are evaluated on a range of criteria that includes, but is not necessarily limited to, an assessment of each company’s: Environmental performance indicators such as its consumption of natural resources, energy usage, greenhouse gas emissions, toxic emissions, use of toxic chemicals, and solid waste generation; Pollution prevention programs and supply chain environmental policies; Compliance with environmental laws and regulations and its potential environmental liabilities; Environmental management infrastructure and governance procedures; Public reporting on an annual basis of its environmental performance… The Balanced Fund does not intend to invest in companies engaged in the extraction, exploration, production, manufacturing or refining of fossil fuels… Summary My analysis clearly shows that there is a wide range in how committed an alternative energy mutual fund may be in its investments. There is a big difference in the holdings of funds like Firsthand Alternative Energy and New Alternatives compared to Green Century. This information should help guide investors interested in green energy mutual funds to help them know what these funds may or may not be holding. * Though not directly involved in alternative energy, environmental stocks include those in the business of recycling, pollution control, clean water supply and related sectors. While their business is related to the goals of alternative energy by reducing pollution and creating a cleaner planet, it is not as directly related as companies in the energy sector. So for the purposes of this analysis, the factor that environmental companies contribute to a mutual fund’s alternative energy focus was reduced. In other words, a water service company like Xylem Inc (NYSE: XYL ) rates lower than a solar panel manufacturer like Trina Solar (NYSE: TSL ).