Scalper1 News
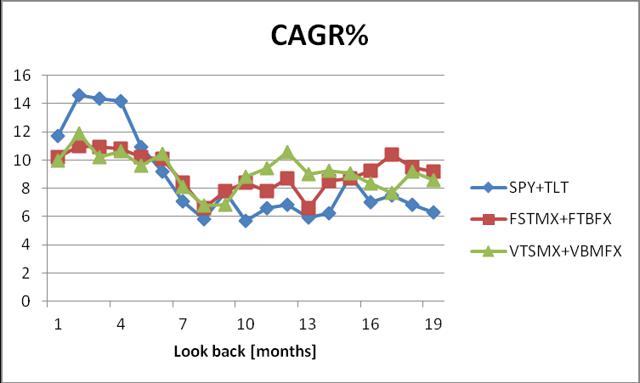
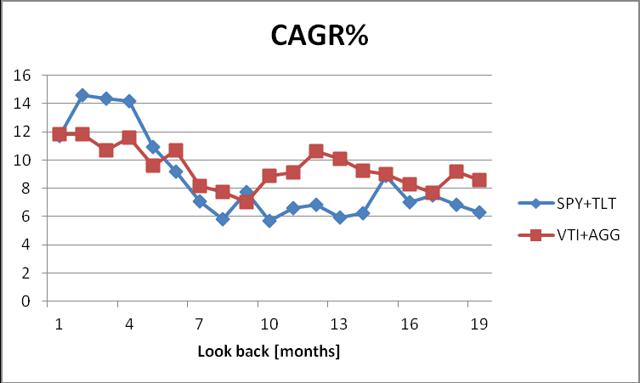
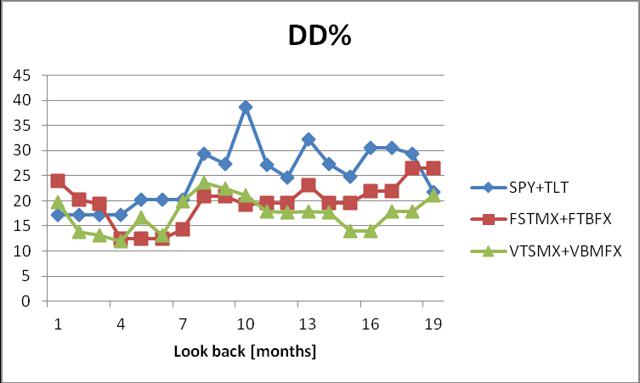
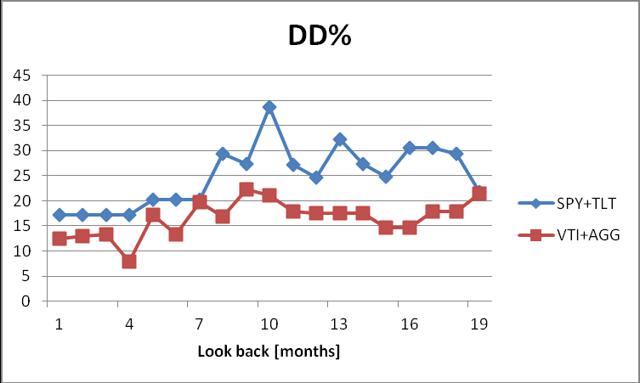
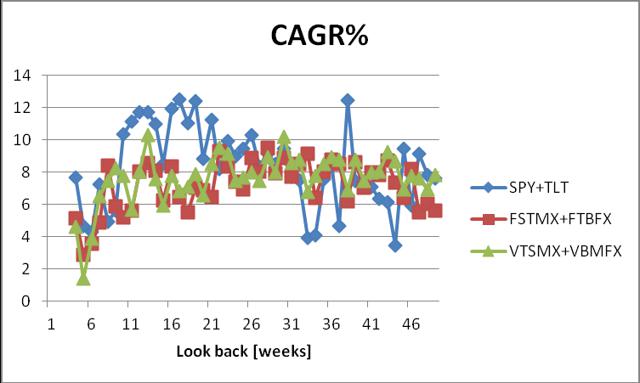
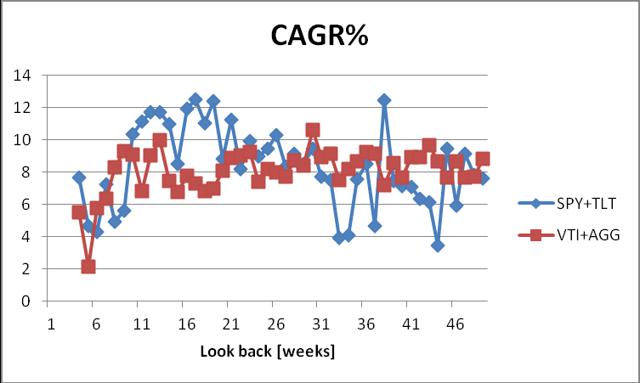
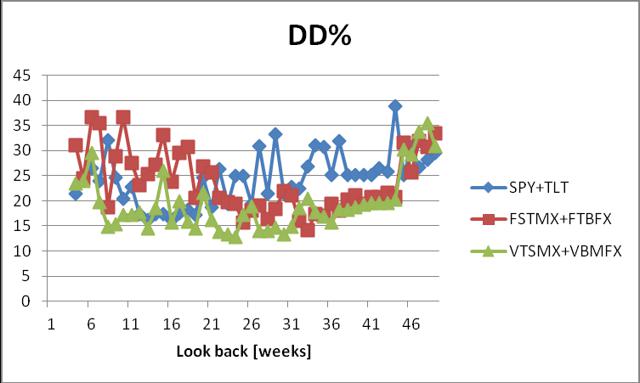
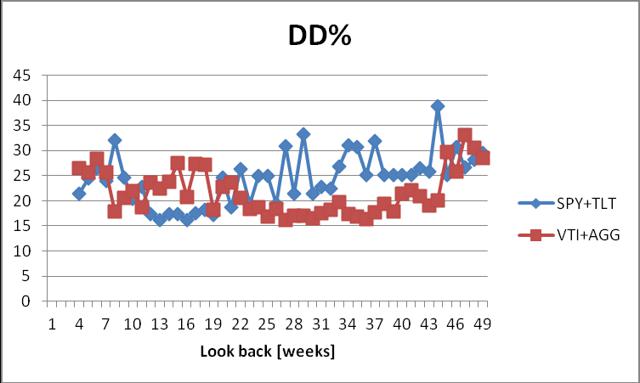 Summary The performance of adaptive asset allocation is sensitive to the look back period, as well as to the frequency of market monitoring. The best performance is obtained by monthly monitoring, which significantly outperforms quarterly or weekly monitoring. For the SPY+TLT pair over the 2004-2014 time interval, the highest CAGRs are as follows: 14.70% for monthly monitoring, 12.93% for quarterly monitoring, and 11.74% for weekly monitoring. The best look back periods are 2 to 7 months, 10 to 20 weeks, and 1 quarter. The relative performance of the adaptive allocation strategy is consistent for ETFs and related mutual funds. We obtained similar effects on (SPY, TLT), (VTI, AGG), (FSTMX, FTBFX), and (VTSMX, VBMFX). In a couple of recent articles , we demonstrated that a very simple and well-diversified portfolio may be made up of two instruments – one representing the total stock market, and the other representing the total bond market. These portfolios are quite robust, and achieve decent returns using simple strategies such as rebalancing and momentum-based adaptive allocation. At the suggestion of some readers, we investigate the sensitivity of the adaptive allocation strategy to the frequency of market monitoring and the duration of the look back period. As in our previous articles, we considered the following four portfolios: one built with the SPDR S&P 500 Trust ETF ( SPY) and the iShares 20+ Year Treasury Bond ETF (NYSEARCA: TLT ) , the second with iShares and Vanguard ETFs, the third with Vanguard mutual funds, and the fourth with Fidelity mutual funds. ETFs portfolio: iShares 20+ Year Treasury Bond ETF and SPDR S&P 500 Trust ETF. ETFs portfolio: iShares Core US Aggregate Bond Market ETF (NYSEARCA: AGG ) and Vanguard Total Stock Market ETF (NYSEARCA: VTI ). Mutual funds portfolio: Vanguard Total Bond Market Index Fund (MUTF: VBMFX ) and Vanguard Total Stock Market Index Fund (MUTF: VTSMX ). Mutual funds portfolio: Fidelity Total Bond Market Index Fund (MUTF: FTBFX ) and Fidelity Spartan Total Stock Market Index Fund (MUTF: FSTMX ). For purposes of comparison, we simulate these portfolios from December 2003 to December 2014, a total of eleven years. The time period of the study was selected based on the availability of historical data of the investment instruments; AGG was created in September 2003. The data for the study were downloaded from Yahoo Finance, using the Historical Prices menu for the eight tickers: SPY, TLT, AGG, VTI, VBMFX, VTSTX, FTBFX, FSTMX. We use the weekly and monthly price data from September 2003 to December 2014, adjusted for stock splits and dividend payments. The article has two parts. In the first part, we discuss the effect of the frequency of market monitoring. The second part presents the effect of varying the look back period. Part I: Quarterly, Monthly, and Weekly Market Monitoring The first study was done on the SPY+TLT. We compare the results obtained by monitoring the market quarterly, monthly, or weekly in the following manner. Quarterly monitoring is done at market closing on the last trading day of each quarter. Monthly monitoring is done at market closing on the last trading day of each month. Weekly monitoring is done at market closing on the last trading day of each week. The portfolio is at all times invested 100% in either SPY or TLT. All the funds are invested in the instrument with the highest return over the current look back period. The following look back periods were utilized in our simulations: 1 to 4 quarters for quarterly monitoring; 2 to 20 months for monthly monitoring; 5 to 50 weeks for weekly monitoring. The data below show the best investment results over 11 years, from January 2004 to December 2014. The first line is for quarterly monitoring with a 1-quarter look back period; the second is for monthly monitoring with a 3-month look back period; the third for weekly monitoring with a 13-week look back period. It is apparent that monthly monitoring delivers significantly better results than weekly or quarterly monitoring. Table 1. SPY+TLT quarterly, monthly, and weekly monitoring of portfolios January 2004-December 2014 Total Return% CAGR% Max DD% Number of trades Quarterly 281.1 12.93 -19.59 22 Monthly 347.0 14.70 -17.13 29 Weekly 141.1 11,74 -17.37 60 Part II: The Effect of the Look Back Period The effect of the look back period is presented separately for quarterly, monthly, and weekly monitoring. For quarterly monitoring , the look back period was varied from 1 quarter to 4 quarters. The results obtained for the SPY+TLT portfolio are shown in Table 2. It is apparent that a look back of one quarter is significantly better than any other period. Table 2. SPY+TLT quarterly, look back periods from 1 to 4 quarters January 2004-December 2014 Look back [quarters] Total Return% CAGR% Max DD% Number of trades 1 281.1 12.93 -19.59 22 2 77.2 5.20 -29.80 17 3 77.6 5.21 -31.54 14 4 56.4 4.15 -36.75 12 For monthly monitoring , the look back period was varied from 2 months to 20 months. The first two figures show the scatter of the compound annual growth rate (CAGR). A few observations can be made from analyzing these results: The SPY+TLT portfolio is the most sensitive to a change in the look back period. A look back period between 2 and 4 delivers the highest returns. VTI+AGG, as well as the mutual fund portfolios are little sensitive to changes in the look back period. Still, a look back period in the 2-6 month range delivers higher returns. (click to enlarge) Figure 1. CAGR for monthly monitoring with look back periods from 2 to 20 months. Source: This chart is based on Excel calculations using the adjusted monthly closing share prices of securities. (click to enlarge) Figure 2. CAGR for monthly monitoring with look back periods from 2 to 20 months. Source: This chart is based on Excel calculations using the adjusted monthly closing share prices of securities. (click to enlarge) Figure 3. Maximum drawdown (DD) for monthly monitoring with look back periods from 2 to 20 months. Source: This chart is based on Excel calculations using the adjusted monthly closing share prices of securities. (click to enlarge) Figure 4. Maximum drawdown for monthly monitoring with look back periods from 2 to 20 months. Source: This chart is based on Excel calculations using the adjusted monthly closing share prices of securities. For weekly monitoring , the look back period was varied from 5 weeks to 50 weeks. The first two figures show the scatter of the compound annual growth rate . A few observations can be made from analyzing these results: The SPY+TLT portfolio is the most sensitive to a change in the look back period. A look back period between 10 and 21 weeks delivers the highest returns. VTI+AGG, as well as the mutual fund portfolios are not very sensitive to changes in the look back period. (click to enlarge) Figure 5. CAGR for weekly monitoring with look back periods from 5 to 50 weeks. Source: This chart is based on Excel calculations using the adjusted weekly closing share prices of securities. (click to enlarge) Figure 6. CAGR for weekly monitoring with look back periods from 5 to 50 weeks. Source: This chart is based on Excel calculations using the adjusted weekly closing share prices of securities. (click to enlarge) Figure 7. Maximum drawdown for weekly monitoring with look back periods from 5 to 50 weeks. Source: This chart is based on Excel calculations using the adjusted weekly closing share prices of securities. (click to enlarge) Figure 8. Maximum drawdown for weekly monitoring with look back periods from 5 to 50 weeks. Source: This chart is based on Excel calculations using the adjusted weekly closing share prices of securities. Conclusions The performance of adaptive asset allocation is sensitive to the look back period, as well as to the frequency of market monitoring. The best performance is obtained by monthly monitoring, which significantly outperforms quarterly or weekly monitoring. The optimal look back period varies with the type of assets that make up the portfolio. For the assets considered in this study, the best look back periods are 2 to 7 months, 10 to 20 weeks, and 1 quarter. The author prefers a look back period of 3 months in conjunction with monthly monitoring. Scalper1 News
Scalper1 News