Tag Archives: function

The Gone Fishin’ Portfolio: 14 Years Of Market-Beating Returns
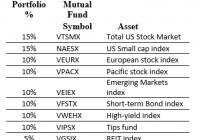
I’ve always been fascinated by ‘Couch Potato’ portfolios, those where you invest in index mutual funds and rebalance only once per year. In the early 2000’s I read about the ‘Gone Fishin’ Portfolio. ‘Gone Fishin’ was intriguing because it is based on the work of Harry Markowitz, who won a Nobel Prize in 1990 for Modern Portfolio Theory – now known as asset allocation. Asset allocation is the process of developing the most effective – optimal – mix of investments. In this case, optimal means that there is not another combination of asset classes that is expected to generate a higher ratio of return to risk. Quite simply, it’s breaking down your portfolio into different baskets, or classes of investments, to maximize returns and minimize risk. Asset allocation is based upon the principal that non-correlated investments of varying risk, when astutely mixed together, will smooth out the volatility (or variability) of your returns. And the best part about it is that it also increases your returns. Alexander Green of The Oxford Club took the work of Markowitz and gave it a name – ‘The Gone Fishin’ Portfolio.’ The allocations are: So we have 30% U.S. Stocks, 30% International Stocks, 30% Bonds, then 5% REITs and 5% Gold/Precious metals. A nice well-balanced portfolio. Advantages of the ‘Gone Fishin’ Portfolio, and other Lazy portfolios, are that they help address four major investment risks: Being too conservative. Being too aggressive. Trying and failing to time the market. Using expensive fund managers (Recommend Vanguard funds) Back 14 years ago when I first heard of the Gone Fishin’ Portfolio, I thought that replacing the index funds with active managers (while keeping the same % allocation) might even be better than this passive index approach. I knew lots of great fund managers whom I thought would beat their index in the long term, so why not utilize their expertise within the Gone Fishin’ framework? I called this creation the ‘Masters Select’ Gone Fishin’ Portfolio. I then created an Excel spreadsheet to track both styles, and have updated it each January for the last 14 years. Here’s the ‘Masters Select’ Gone Fishin’ Portfolio I set up 14 years ago: So you can see in most cases I replaced the passive index fund with a favorite active manager. Fairholme Fund for the Total U.S. market, and Third Avenue Value for small caps. Matthews Asian Growth & Income for the Pacific stock index. And Third Avenue Real Estate replaced the REIT index. Back 14 years ago I could not identify a worthy active manager for the European or Emerging Markets indices, so I left these as the passive index. For Bonds, I took the combined 30% allocation and divvied it between two excellent bond managers – Bill Gross of Managers Fremont Bond, and John Hussman of Hussman Strategic Total Return. And I replaced the normal Gone Fishin’ precious metals fund with a broad commodity fund. I’ve been tracking the results of both the official Gone Fishin’ portfolio and my ‘Masters Select’ version. Here are the results. The standard Gone Fishin’ portfolio has performed as advertised, soundly beating both the S&P 500 and a 60/40 Stock/Bond portfolio. On a risk-adjusted basis the Gone Fishin’ portfolio does extremely well (the whole idea behind Markowitz theory), with the drawdowns in bad years less than the stock market. My ‘Masters Select’ Gone Fishin portfolio did even better than the Markowitz model. Half the time (7 of 14 years) it beat the other three portfolios, and had a total return better than the standard model. I should emphasize I did not replace an active manager during the entire 14 year period, so there’s no bias there. Of course perhaps I was lucky (or good) with the picks. Further, by using active managers, I realize I was introducing ‘tracking risk’ to the portfolio, where a manager strays away from the intended index. Nevertheless it paid off to combine these pros with a Nobel prize-winning framework. Of some concern – the Gone Fishin’ portfolios started off with a blast, beating the S&P 500 for 10 straight years (2001 – 2010). But since then they have underperformed. This also happened in the late 1990’s when the S&P 500 was in its strongest bull phase and international stocks were out of favor. We seem to be in a similar era right now and I expect the underperformance to be temporary. One other concern I have with the ‘Masters Select’ Gone Fishin’ concept is the fund size. Fairholme Fund and Third Avenue Value have grown incredibly in the past 14 years. Size is an anchor to performance, particular with small-cap funds. If I started this today I may choose a few different funds, or a combination of active funds.
What’s Hot, What’s Not: SPY And Select Sector SPDRs At The Dawn Of 2015

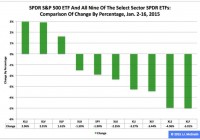
Summary The SPDR S&P 500 ETF has not had a happy new year thus far, shedding 1.90 percent in the first 11 trading days of 2015. During this period, the Utilities exchange-traded fund was first by return among the Select Sector SPDRs, rising 2.96 percent. Over the same time frame, the Financial ETF was last by return among the sector SPDRs, falling -5.01 percent. The U.S. equity market’s large-capitalization segment has been characterized by the relative overperformance of low-beta Select Sector SPDRs and the relative underperformance of high-beta sector Select Sector SPDRs in 2015 year to date, just as it was in 2014. Meanwhile, their parent proxy, the SPDR S&P 500 Trust ETF (NYSEARCA: SPY ) has struggled this year, as it dipped to $201.63 from $205.54, a drop of -$3.91, or -1.90 percent. This long-term sector rotation appears important for multiple reasons at this late stage of the economic/market cycle. With respect to economic matters, the International Monetary Fund cut its forecast Tuesday for global growth this year, to 3.5 percent from 3.8 percent, and the World Bank Group did likewise Jan. 13, to 3.0 percent from 3.4 percent. With respect to market matters, the S&P 500’s cyclically adjusted price-to-earnings ratio is at the historically lofty level of 26.77, according to 2013 Nobel Prize-winning economist Robert J. Shiller . Appearing below are comparisons of changes by percentages in SPY and all nine sector SPDRs in 2015 year to date, last month, last quarter and last year. Figure 1: XLU No. 1 Among Select Sector SPDRs This Year (click to enlarge) Source: This J.J.’s Risky Business chart is based on analyses of adjusted closing daily share prices at Yahoo Finance . In 2015, the Utilities Select Sector SPDR ETF ( XLU ), Health Care Select Sector SPDR ETF (NYSEARCA: XLV ) and Consumer Staples Select Sector SPDR ETF (NYSEARCA: XLP ) have been not only the best behaved but also the only ones with positive returns among the sector SPDRs that break the S&P 500 into nine chunks. Elsewhere, I indicated it is an article of faith (and statistical interpretation) hereabouts that so-called PUV analysis is better than psychoanalysis in determining Mr. Market’s state of mind. What is PUV analysis? It is basically the study of the behaviors of XLP, XLU and XLV in comparison with their sibling sector SPDRs. If the PUV cluster of ETFs ranks in or near the top third of the sector SPDRs by return during a given period, then I believe market participants are in risk-off mode; if the PUV cluster of ETFs ranks in or near the bottom third of the sector SPDRs by return over a given period, then I think market participants are in risk-on mode. Given the relative performances of XLP, XLU and XLV that have them in the top three spots among the sector SPDRs this year, I believe market participants are in risk-off mode. And I think they will continue to be so, with changes in policy at the U.S. Federal Reserve the biggest reason why. In this context, I note the Fed announced the conclusion of purchases under its latest QE program Oct. 29 and that the ends of purchases under its previous two formal QE programs are associated with both a correction and a bear market in large-cap stocks, as evidenced by SPY’s dipping -17.19 percent in 2010 and dropping -21.69 percent in 2011. Figure 2: XLU No. 1 Among Select Sector SPDRs In December (click to enlarge) Source: This J.J.’s Risky Business chart is based on analyses of adjusted closing daily share prices at Yahoo Finance. XLU also was the big winner among the Select Sector SPDRs last month, when the Technology Select Sector SPDR ETF (NYSEARCA: XLK ) was the big loser in the group. I suspect XLK may continue to struggle this year, with one large reason being the bias divergence in monetary policy at major central banks around the world. On the one hand, the U.S. Federal Reserve is oriented toward tightening; on the other hand, the Bank of Japan, European Central Bank and People’s Bank of China are oriented toward loosening. This divergence has led to significant movements in exchange rates, such as in the euro and U.S. dollar currency pair, or EUR/USD. The EUR/USD cross fell from as high as $1.3992 May 8 to as low as $1.1459 Jan. 16, a tumble of -$0.2533, or -18.10 percent, based on data at StockCharts.com. The change in EUR/USD and similar moves in other currency pairs indicate a strengthening greenback and a weakening everything else could pressure earnings of U.S. companies in sectors with substantial international businesses, which most likely will be a headwind for many of XLK’s components. Anyone doubting the effects of central-bank policy on financial markets should take a close look at the impacts associated with the Swiss National Bank’s surprise decision to discontinue its fixing of the minimum exchange rate between the Swiss franc and the euro last week, which I briefly covered in a piece at the International Business Times . Figure 3: XLU No. 1 Among Select Sector SPDRs In Q4 (click to enlarge) Source: This J.J.’s Risky Business chart is based on analyses of adjusted closing daily share prices at Yahoo Finance. XLU also ranked No. 1 among the Select Sector SPDRs last quarter, while the Energy Select Sector SPDR ETF (NYSEARCA: XLE ) ranked No. 9 in the group. Recently, I argued lockstep movements of the EUR/USD currency pair, the commodity price of crude oil and the share price of XLE appear likely to continue unless the Federal Open Market Committee makes clear it will delay the anticipated announcement of its interest-rate hikes April 29 and that it is preparing to carry out asset purchases under its fourth formal quantitative-easing program of the 21st century, aka QE4. I also argued the FOMC may be hard-pressed to present a convincing rationale for those actions, given the conditions described in “SPY Slips And U.S. Economic Index Slides In December” and that, without them, XLE might continue to be the equivalent of a canary in coal mine where things are looking darker by the day. These arguments still make sense to me. Meanwhile, I anticipate being underwhelmed by the ECB action or inaction on its own QE to come Thursday, and I expect Mr. Market will be so, too, except on a short-term trading basis, with plenty of sound and fury, signifying (nearly) nothing. Figure 4: XLU No. 1 Among Select Sector SPDRs In 2014 (click to enlarge) Source: This J.J.’s Risky Business chart is based on analyses of adjusted closing daily share prices at Yahoo Finance. I am detecting a pattern here: XLU also led the way among the Select Sector SPDRs last year, when XLE lagged the rest of its siblings. Consistent with the above discussion of PUV analysis, I consider XLU key to the assessment of market sentiment based on the comparative behaviors of the sector SPDRs. If XLU ranks near No. 1 by return during a given period, then I believe market participants are in risk-off mode; if XLU ranks near No. 9 by return over a given period, then I think market participants are in risk-on mode. In the current environment, I therefore would be completely unsurprised should XLU continue to behave well this quarter and this year, not on an absolute basis but on a relative basis (i.e., in comparison with the other sector SPDRs and with SPY). The ETF may not produce gains, but it might produce losses smaller than those of its siblings, which is another way of saying SPY looks vulnerable, right here, right now. (Unless, of course, the Federal Reserve comes riding to the rescue, as it did in 2010, 2011 and 2012.) Disclaimer: The opinions expressed herein by the author do not constitute an investment recommendation, and they are unsuitable for employment in the making of investment decisions. The opinions expressed herein address only certain aspects of potential investment in any securities and cannot substitute for comprehensive investment analysis. The opinions expressed herein are based on an incomplete set of information, illustrative in nature, and limited in scope. In addition, the opinions expressed herein reflect the author’s best judgment as of the date of publication, and they are subject to change without notice.

Active Vs. Passive Investing: The Real Scoop

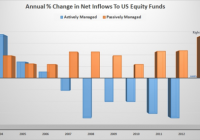
As of October 31st, investors had plowed over 60 billion into passive index funds this year while yanking over 80 billion away from actively managed funds. Statistics, on their face, can mislead us quicker than they can enlighten. Of all the US Large Cap Equity funds that had both high ownership and low cost, over 75% of them outpaced the indexes on a 5 year rolling return and. Like fitness bands and frappuccinos, index funds are high fashion. As of October 31st, investors had plowed over 60 billion into passive index funds this year while yanking over 80 billion away from actively managed funds. And why not? It’s well known most active managers do not outpace their benchmarks. Index funds are cheap, simple, and the upkeep is nominal. Indeed, more than ever, the joes, and pros, are turning to index based investing. On the other hand, we cannot deny the fact that investors feverishly jump into trends at precisely the wrong time. So, are index fund investors truly onto something or are they somehow being misguided? First, and for a quick refresher; index funds are investment vehicles that provide a way to closely mimic the returns of a specific index – such as the S&P 500. There are hundreds of indexes and over a thousand index funds. Each index is designed to track an area of a certain market and is formed by its own set of specific criteria. Since the criteria is based on objective data, there’s no need for an index fund to pay big money or bonuses to an investment manager as they need only copy their corresponding index. Consequently, the management of an index fund is largely administrative; hence, the low expense ratios and portfolio turnover. (Note: The data and observations provided are not exhaustive. All references herein are in regards to equity based funds only. ) Much of the frenzy over index funds has come from academic research showing that actively managed funds do not typically beat their respective index. For example, in a recent study by Standard & Poors, less than 30% of active fund managers outperformed their indexes in any given year between March 2009 and March 2014. Of the managers who did outperform the market, only a few did so with any significant edge. Of greater “consequence” to investors, over the 5 year period, less than 1% of the managers were able to return to the top quartile of funds for 5 consecutive years. What this means is that in that period of time, if you had simply invested in an S&P 500 index fund, which required no active portfolio management, you would have earned a better return than more than half of the portfolio managers. And this is just a small example, as there are many studies out there that point to the same thing – cheap, simple, index funds put the odds in your favor. Active managers rarely consistently beat the indexes therefore their typical 1.5% annual fee cannot be justified. So, considering the overwhelming evidence against active managers, it would be downright foolish not to join in with the index fund movement…..right? Well, not so fast. “There are lies, damned lies, and statistics.” – Mark Twain Statistics, on their face, can mislead us quicker than they can enlighten. Notwithstanding the reality that most active managers do in fact drift under the indexes, we must push onward, and look deeper into what information is being shown, or not. First, we need to acknowledge that these numbers do not include separate and private wealth managers. So, right off the bat we’re missing some of the very best in the business. (Ahem) That aside, what about the managers who do in fact consistently outpace their indexes? Are they just a lucky few? Maybe. But what if we could find a common characteristic, or positive correlation between them? Perhaps that would grab the attention of even the most dogmatic of index investors. Morningstar’s 2014 US Mutual Fund Stewardship Survey shows and highlights precisely these types of correlations. In the study, they discover two notable common characteristics between the top ranking active managers: High Manager Ownership – This firms where 80% of the assets managed have at least 1 manager owning 1 million dollars or more of the shares. Low Expenses – This is firms charging 1% or less. The report shows managers with these two characteristics exhibit very high levels of success. How high? Capital Group, a division of the behemoth American funds, took this research and dug even deeper to find some very powerful information. Their research piece, The Active Advantage , sifts through Morningstar’s research and highlights many interesting tidbits. One item they found stands out quite powerfully all alone: Of all the US Large Cap Equity funds that had both high ownership and low cost, over 75% of them outpaced the indexes on a 5 year rolling return and 100% of them beat the indexes on a 10 year rolling return. Therefore, by simply screening for funds with reasonable expenses and good ownership, we can completely reverse the aforementioned stats against active managers. While the oft maligned world of active management does have some merit, it seems unwise to forever close one’s mind to a concept that works incredibly well for so many. We simply need to find a better way to measure the quality of an active manager. Expenses, firm structure, and manager incentive is a start. The truth is, much of investing is about getting yourself, and your portfolio, on firm ground. Don’t make beating the market your only goal. Try to put the odds in your favor by focusing on things you can control such as expenses, taxes, portfolio cash flow, and of course proper incentive if you have an investment advisor or manager. Finally, it’s old hat, but I must say that chasing market returns, whether passively or actively, isn’t usually a good idea. Pouncing on the highest number as of late, is exactly that – late. Yet, oddly enough that is precisely how the industry works. Investors want to see good past performance, and many advisors screen and sell off off these high numbers. Active managers are continually being threatened by the rise of index funds so they’ve become even further pressured to outpace the indexes. That is, until the indexes turn around and head in the other direction. Unquestionably, much of this is a circular problem – with the average investor stuck in the loop.