Best-Now Energy Stock Wealth-Builder Picks, Seen By Big-Money Fund Managers
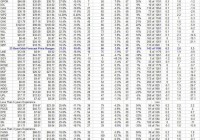
Summary How do we know what the big boys are buying, and how far they may chase the prices up before they bail out? Answer: Ask their helpers, the market-makers. Fund manager [FM] focus on energy investment candidates, sharpened by oil price declines, gets defined by their big-volume stock trade orders, stretching market capacity beyond normal limits. Market-makers [MMs] expand capacity, putting firm capital at risk temporarily, but only when their exposure is hedged by skillful arbitraging of related equity derivatives. What the MMs will pay for that protection, its embedded cost accepted by FMs to get their trades filled, confirms (by using Intelligent Behavior Analysis) how far prices might range. Those ranges provide sound logic and prior experiences to use in choosing between investment candidates in everyday capital commitment contests. What energy stocks are most depressed now? We apply Intelligent Behavior Analysis to all energy-related stocks (as well as over 2,000 other stocks and ETFs) every day, deriving price-change prospects, not past changes, for all on a directly comparable basis. Only then do we look at how expectations similar to the current-day have in the past matched up with their actual market outcomes. That gives us quality measures of odds of performance and credibility of current outlooks. Measures that help rank the attractiveness of many alternative investment choices by differing dimensions for investors with their own preference emphasis and current opportunity/need tradeoff situations. Given the huge price declines in Crude Oil, the basic common denominator of the energy business, and the likelihood of its getting overdone and rebounding, the stocks most directly in that line of fire are the Exploration & Production [E&P] companies. But that is not taken as a certainty, since what counts is what may be the likely change coming in securities prices, and those are always a product of investor perceptions. So we look at expectations of stock price changes for the various involved energy groups, including 1) international integrated major producers [IIMPs], 2) E&Ps, 3) well drillers [WDs], 4) other oilpatch service providers [OSPs], 5) refiners and mid-line processors [MLPs]. We attempt to separate those companies with predominantly 6) natural gas extraction involvements [NGPs] and 7) energy fuel transporters [PPLs] from those delivering 8) directly usable energy products [UTLs]. It is a big, diverse investment space. Today’s focus is on the E&Ps, nearly 60 of them that provide acceptable inputs to our analysis (out of over 100), displayed in a multi-dimensional rank of preferences common to investing wealth-builders, but containing evaluations of several aspects helpful to different priorities. Here are their current investment dimensions for us to explore and compare in thinking about whether the stocks should be bought here: Figure 1 (click to enlarge) What are these (column) dimensions? Where did they come from? Welcome to the products of Intelligent Behavioral Analysis. Intelligent, because the analysis looks at what discriminating (a desirable term) people do that makes sense, not what humans at large do that is erroneous. Unfortunately, the bulk of “Behavioral Finance” concerns itself with the latter activities. Instead, we are interested in what assistance can be learned from highly successful professionals, to improve our investing performance. Not in finding trivial mistakes people might make so that we can take advantage of them. Columns (2) and (3) of Figure 1 are the price range extremes implied by what market-making professionals are paying to protect the firm capital they must put at risk to be able to reach a balance between buyers and sellers of volume trade orders placed by their big-money fund management clients. Column (5) is the upside percentage price gain between the market quote at the time of analysis (4) and the top of the forecast range (2). Its complement, the downside forecast, is not shown in price change terms, but is indicated as a proportion of the whole forecast range in (7). That Range Index [RI] number is the percentage of the forecast range that lies below the current price (4). The smaller the RI is, the better quality may be that upside calculation in (5). The RI provides a useful comparison device between stocks with quite different characters, and allows us to look at past forecast experiences of individual stocks across time to better understand how each is likely to behave in coming days, weeks and months. We use it in (12) to determine which of the past 5 years’ 1261 market days of forecasts had an upside to downside forecast like today’s. That sample allows us to apply a simple but effective Time-Efficient Risk Management Discipline [TERMD] to the similar forecasts. The discipline is to “buy” the stock at a cost of the following market day’s close and hold it until the (2) top forecast price is reached or exceeded by a day’s close, or until 3 months (63 market days) beyond the forecast date have passed. If that holding period patience limit is reached the position is closed out, regardless of resulting gain or loss. This simple discipline produces the other column results. (9) is the average (geometric) percentage gain (including losses) of all the sample experiences. (10) tells how long they required capital to be committed, and (11) shows the annual rate of return that produced. The true measure of risks encountered in those experiences is in (6), the average of each of the sample’s worst-case price drawdowns. They indicate the points where emotion is most likely to interfere with an ultimate price recovery. (8) shows what the odds (out of 100) have been that price drawdowns were fully recovered by close-out time of the several positions. These dimensions look to the past as an indication of the quality of the present expectations for the future. Other comparisons may also be compelling. (13) compares (5) with (9) as a measure of how realistic the size of today’s forecast may be in light of what the past accomplished. (14) matches up today’s upside with yesterday’s experienced downsides. How useful are all of these complicated calculations? Each of these measures will likely have varied significance, depending upon the investor’s situation, goals, and preferences. There is no consideration of dividends here, so the approach is of limited use where periodic income receipts are the principal objective. In situations where dividend yields are high because current prices are low, this form of analysis may be helpful in recognizing why the stock’s price is so low, and whether a recovery is likely or even lower prices may be ahead. This style of analysis focuses on price change because it is the most dynamic and productive part of the risk-reward tradeoff, and is most impacting in programs of investment wealth-building. It looks to the effectiveness of capital employment in reaching accumulative goals with the objective of providing for some personal major capital expenditure, such as home acquisition, college expenses for self or offspring, medical emergency/catastrophe, or prolonged retirement. It recognizes that, especially in times like these of political suppression of interest rates, which seriously limit stock dividends and bond interest, the 20th-century emphasis on income investing has become seriously crippled. The volume of capital now required to generate income sufficient to cover everyday needs in retirement has doubled or tripled, depending on one’s standards. Unfortunately, many pension funds, particularly defined-contribution 401-k types, have not produced what is needed. A different approach may be required. What do the E&P stocks offer today? Other stocks? The better-priced two dozen of this set of 60+ stocks (the blue subtotal row) are being hedged by MMs in ways that say higher prices of +21% or more on average can be seen in 3 months or less. Their past experiences at current expectations levels, typically at over 100 instances, have not been nearly as bountiful, with average gains of only +4%, achieved in typical holding periods of two months, for an annual rate of price returns of +31%. The gains are net of losses in one third of their experiences. In those ventures typical worst-case price drawdowns of about -10% were encountered. Here is how the current upside forecasts for all ~60 compare with those price drawdowns: Figure 2 (click to enlarge) (used with permission) Stocks with price drawdowns as large as their upside forecasts would be on the diagonal dotted line. Those with larger upside forecasts are below the diagonal, with those in the green area offering upsides at least 5 times as large as their prior forecast drawdown experiences. The best E&P stock in this comparison at today’s pricing is [22], Memorial Production Partners LP (NASDAQ: MEMP ), offering an 18% upside in the face of prior worst-case average price drawdowns of only -4%. One caution, only 3 experiences in less than 3 years produced the drawdown data for MEMP. A stronger candidate might be Atlas Energy LP (NYSE: ATLS ) at [27], where 49 experiences in nearly 4 years support a +19% upside against -7% drawdown stresses. We can use this Figure 2 comparison of ATLS vs. MEMP to illustrate additional dimensions in what we call the quality of each one’s prospects first suggested by this appropriately-labeled picture of “Reward~Risk TRADEOFFS “. What are the ODDS for success? Column (8) of Figure 1 reports how often each of these two choices have in the past, when being appraised as they are now, produced a price gain. That “score” is put in “times out of 100” terms to make it easier to compare with other alternatives. MEMP scores 100, it has always been a winner. ATLS has been profitable “only” 7 out of every 8 ventures. But how frequently can success be enjoyed? MEMP’s perfect record occurred 3 times out of 419 market days or 7/10ths of 1% of the time, properly viewed, a rarity. ATLS on the other hand gave rewards 43 of its 49 times in 937 evaluations, or 5 times as often as MEMP. And how big were the rewards, how long did it take to earn them? In the 3 opportunities that MEMP put capital to work at an average of +12.7% each (1.127^ 3 or 1.431), ATLS could have had 15 chances to produce a loss-including net gain of +8.8% (1.088^ 15 or 3.544). That looks like no contest, even though the annual rate for MEMP (71%) is significantly higher than for ATLS (55%). To reflect on those differences among all of the candidates for potential investment in this set of stocks, we have assembled a logical “figure-of-merit” measurement to use as a ranking device. The numeric values produced have no easy description, and are useful mainly in ranking desirability between alternative choices where wealth-building is the long-term objective, to be achieved by repeated active management of investments. Its results are shown in column (15), and each subgroup of the E&P stocks are ranked thereby. It turns out that ATLS ranks second-highest with a figure of merit of 6.9 after Carrizo Oil & Gas (NASDAQ: CRZO ) at 10. But are there better still other choices? Take a look at the blue totals and averages lines at the bottom of Figure 1. They provide a comparison for individual stocks with the group, and with our large population as a whole. There is also the current appraisal of the SPDR S&P500 ETF (NYSEARCA: SPY ) as an investible approximation of the equities market. The E&P set of 59 stocks offers a typical upside of +22.6%, almost twice that of the population as a whole, and three times SPY’ +7%. But SPY has had only 1/3rd of the E&P set’s worst drawdown experiences. Of more interest, the E&P set’s win odds as a group are dreadful at 58 out of 100, worse than the population’s 2 out of 3 and SPY’s ~8 out of ten. And the E&P set’s net payoff experiences (9) at less than 1/2 of 1% reflect the win odds. Their aggregate figure of merit, -8.9, in (15) tells the sad story of adventuring in all these stocks, especially at present levels of expectations. The best-ranked 23, in the blue row subtotal above, at least manages to convert that FOM to a +1.3. But even that is not competitive with SPY at 2.9. A strikingly better choice at this price and point in time may be the SPDR S&P Oil & Gas Exploration and Production ETF, (NYSEARCA: XOP ). Its analysis results are shown just below those of SPY. XOP has a 5-year, 59 prior forecasts with less than 1/4th of its forecast range to the downside. Buys at today’s forecast balance have been profitable 78 out of 100, about the same as SPY, but generated net gains of +6.1% in 2 1/2 month holding periods for an annual rate of +34% and a figure of merit far better than any of the others. The embedded advantage of diversification via the ETF instrument is quite clear here. Conclusions Now please remember this is not an appraisal of which E&P has the best resources in the ground, or in the management suite. Nor does it care about earnings per share or PEG ratios, or debt/EBITDA calculations. They are all important, but they are already embedded in the perceptions of the game’s players who have the money muscle and the intent of taking actions to move prices. Act now, because tomorrow’s prices will likely offer different odds and different payoffs in different investments. Each day is a new opportunity set, and we only have from now on. And it is how prices move that makes the difference to wealth-building investors. Those who, as “Adam Smith” described in “the Money Game”, are intent on “cuddling Comsat” will find ample reason to ignore all our complexities. And the well-fixed 1% that the “Occupy Wall Street” crowd railed over has typically ample capital to apply to trivial current dividend and bond yields, sufficient to fund their retirements and bequest their inheritors. It is the far more numerous less fortunate investing public that has hoped their 401-k plans would do more than be a piggy-bank for tax-sheltered savings that now is largely faced with this second job of investing. They have learned that if you want something important done, you better supervise it closely and intently. For most, that has not happened, and now time is closing in on an uncomfortable future. The kind of analysis we do is intended to escape the self-serving biases of the deliverymen while encapsulating essential minutia by relying on their logical motivations to provide informed guidance on price prospects that can be found nowhere else. The results can never be perfect, since not everyone can “win” in a zero-sum game. But for those that are motivated by desire, need, and obligation, to make the effort to improve their odds and their perspective, substantial improvement in their investment results is still probable. For the other investors, well, the profits have to come from somewhere.