Tag Archives: function

Cotton Continues Its Bounce Along The Bottom
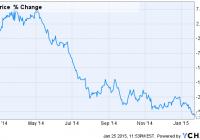
Summary Prices over the last several months have trended lower. Petroleum prices will continue to put downward pressure on cotton. The 2015 U.S. planting season begins in mid-March. Introduction During my last article, the 2015 outlook for cotton , I remained somewhat optimistic that this commodity would find a bottom. Even given that assessment, I recommend that you avoid iPath Dow Jones-UBS Cotton Total Return Sub-Index ETN (NYSEARCA: BAL ). That assessment has again proven to be correct. Let’s take a look at the past years performance: Article Date Recommendation Closing price for BAL 7/18/2014 Avoid 45.65 9/26/2014 Avoid 41.35 Table created by Nathan Buehler As of market close on 1/23/2015, BAL is trading at $39.02 per share. 2015 planting season My outlook last year was that U.S. farmers would choose other, more profitable crops to plant, instead of cotton. This, so long as the downward trend in prices continued. The downward trend has continued and we are now nearing 2015 planting decisions. Below is a good read supporting my position: Agweb.com: 2015 Outlook: Get Ready for a Cotton Crop Swap? Other recent developments, such as the drop in corn prices due to lower oil, have me revisiting this topic. Many other agricultural commodities, not just cotton, have come under pressure recently due to the drop in oil. See the upcoming events below for more insight. Upcoming events Several events in February bear watching. The National Cotton Council will release results of U.S. cotton producers’ survey on February 7th. Per their website, they are expecting a decline in acreage for the 2015/2016 planting season. On February 20th, the USDA will release preliminary estimates on everything from trade to production of cotton. You can view their currently released data here . These events are very important. Both will shed light on what farmers are thinking for 2015. If other crops are seeing the same margin pressures as cotton, we could see farmers hold the line. Even with this sector’s pressures, I see a significant decline in acreage for cotton in the U.S. Supply (click to enlarge) Chart retrieved from Cotton Inc. on 1/26/15 Supply continues to run higher than demand adding to global stocks. Global stocks-to-use are at all-time highs thanks to China’s reserve policies. During the past articles we discussed how technological advances in India have pushed their yield per acre up significantly over the past decade. India is now poised to overtake China as the number one cotton producer in 2015. Will India reduce acreage in 2015? Analysts are saying yes. China continues to have significant stocks and is sticking to its import quota to promote domestic demand. Current reports show that Chinese farmers are predicted to plant 15% less acreage of cotton in 2015. The Delta Farm Press is reporting that globally, acreage could decline about 10%. I recommend a read of their article here . It highlights many global points on production, including the water situation in Australia. Demand On the other side of the coin, demand for cotton has remained relatively steady. (click to enlarge) Chart retrieved from Cotton.org and based on estimates from the World Agricultural Outlook Board of USDA. 1/26/2015 Global economic news over the past several months has not been positive. China has continued to post lower than expected growth. Europe has announced several additional stimulus measures to prop up regional growth. The IMF has revised global growth down to 3.5%. None of these developments are a buy signal for cotton and put further downward pressures on its price. China could be experiencing problems with its reserves. Several mills have reported quality problems. I encourage you to read this article which goes into greater detail on the situation. Should this develop into a larger problem, it could cause a short-term spike in prices. Oil/Polyester Oil is a direct competitor of cotton through polyester. Polyester prices have followed the decline in oil, though not as drastically. Cotton prices have remained depressed and I don’t see the drop in oil as being a huge negative for cotton. If anything, consumers could see more disposable income which could boost demand for cotton products. Chart retrieved from: link I found the below chart interesting and wanted to share: Conclusion To prevent redundancy, as your time is valuable, I have tried to include many links to good reads in this article. February will be a foundational month for cotton futures. Are we going to put a floor or ceiling on prices? After analyzing the supply and demand data, preliminary production outlook, and the possible quality problems in China, I see cotton putting in a floor in February. I am changing my avoid rating of BAL to neutral. I personally believe better opportunities exist in the market right now outside of cotton. For the remainder of 2015, I am looking for oil to be the best performing commodity. This is always dependent on the economic outlook and the stimulus measures in Europe taking hold. I sincerely thank you for reading and I hope this article helps you in your investing decisions.
Momentum Serves This Financial ETF Well

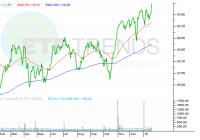
Summary Financial stocks have been underperforming in the new year. However, one financial ETF that focuses on momentum plays has been outperforming. A look at the PowerShares DWA Financial Momentum Portfolio ETF. By Todd Shriber & Tom Lydon It is no secret that the financial services sector, the second-largest sector weight in the S&P 500 behind technology, has struggled to start 2015. For example, the Vanguard Financials ETF (NYSEARCA: VFH ) is down nearly 2%. With a similar loss, the Financial Select Sector SPDR ETF (NYSEARCA: XLF ) is the worst performer of the nine sector SPDR ETFs to start 2015, but all is not lost for ETFs tracking financials. On Thursday, 37 ETFs made fresh all-time highs. The PowerShares DWA Financial Momentum Portfolio ETF (NYSEARCA: PFI ) was one of those 37. PFI was one of 10 PowerShares ETFs, including nine sector funds, that transitioned to momentum-based Dorsey Wright indices in February. Those indices focus on identifying stocks with impressive relative strength, and have fostered performance advantages for several other ETFs in that PowerShares stable. In the past year, PFI has trade in line with rival cap-weighted financial services ETFs, but over the past six months, the momentum-driven PFI has started to pull away from its competitors. In that time, PFI has surged 9%, double the performance of VFH over the same period. Its industry mix is a big reason why. While traditional financial services ETFs have been plagued by slack earnings results, increased regulatory burdens and high legal fees for big money center banks, PFI has been somewhat immune to those themes, because the ETF currently allocates just 18% of its combined weight to banks and capital market firms. The ETF is home to just one money center bank: Wells Fargo (NYSE: WFC ). No investment banks are found in the fund. Conversely, PFI allocates nearly 46% of its weight to real estate investment trusts (REITs), and with Treasury yields tumbling for over a year, that has been a boon for PFI. The heavy REIT allocation exposes PFI to interest rate risk. Some may be concerned that REITs are sensitive to changes in interest rates. Notably, the fall in interest rates have made the asset more attractive as a yield-generating alternative, but some fear the asset will fall out of favor once rates rise. PFI’s 11.6% weight to the insurance sub-sector provides some relief in the event rates do rise. Rate-sensitive insurance companies and the corresponding ETFs have been decent, though market-lagging performers as the group waits on higher interest rates to drive further share price appreciation. PowerShares DWA Financial Momentum Portfolio ETF (click to enlarge)

Dogs Of The Dow Part II And The Return Of The Goldbugs?

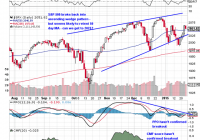
Summary SunAmerica Focused Dividend has turned it around in 2015, are the Dogs of the Dow back? Can active managers catch up after a disastrous 2014? Can the Goldbugs find a way to shine in 2015? It has only been three weeks since our posting on SunAmerica Focused Dividend (MUTF: FDSAX ) and while the ‘Dogs of the Dow’ may have continued to slumber since then, something is definitely working for the fund. In the 7th percentile on a YTD basis, the fund has delivered a solid 2.79% return since our posting compared to 1.55% for the S&P 500 and .82% for the Russell 1000 Value iShares. While we always like to see ourselves proven right (who doesn’t?), the reasons why FDSAX has outperformed so far in 2015 could spell more trouble for active management in the year to come. The secret to FDSAX’s strong performance in 2015 really isn’t that hard to figure out; just head over to Morningstar.com and check it out. What’s in the secret sauce? Well it’s not the Dogs of the Dow although only 4 of the Dogs it holds are underperforming the Dow Jones Industrial Average so far this year. The secret to their success; video games and cigarettes or put another way a deeply discounted retailer (Gamestop (NYSE: GME )) and the 4 largest remaining cigarettes manufactures in the world, the foundations of the consumer staples category. What’s made FDSAX so successful is that incredible difference in performance between the different sectors of the market with a spread of nearly 800 bps between utilities (the Utilities Select Sector SPDR ETF ( XLU) – up 4.07%) and financials (the Financial Select Sector SPDR ETF ( XLF) – down 3.88%) in 2015. For the same period of 16 trade days at the start of 2014, the spread between healthcare and consumer cyclicals was only 594 bps. If the trend continues, 2015 is shaping up to be another year that separates the true active managers from the closer indexers. Let’s start by taking a look at the broader market to see what we can make of the situation. Starting with a daily chart, the S&P 500 was pulled back into the late 2014 ascending wedge on the promise of the new ECB QE program along with a spate of negative economic reports here at home that lite the hope that the Fed’s anticipated rate hike program is on hold. (click to enlarge) While Thursday’s price action was a welcome change, all things considered the weekly action was unimpressive. The volume heading into Thursday was steadily diminishing and Friday’s close just off the lows failed to confirm the move higher. Today’s election of a new leftist government in Greece probably won’t help the open on Monday. As of press time (10:30), the VIX futures had jumped although we backing off the highs. On a weekly basis, you can see the S&P bounced off the first potential stopping out point, but we’ll need to see follow through this week to confirm whether this is just a bounce off one day’s positive news. The fact that the news that lifted the market originated overseas rather than here doesn’t strike me as particularly positive. (click to enlarge) What’s more worrying for trying to separate the closet cases from the true active managers is that the internal make-up of the market doesn’t show any signs of improving although the recent trend towards defensive sectors might be running out of steam. First let’s start with this chart showing the percentage of stocks above their 200 day moving average. You can see that the percentage is way off, even after Thursday’s big one day spike but you have to consider what did well versus what lagged last week. (click to enlarge) Sector wise, Healthcare and Financials make up nearly 30% of the S&P 500 and both lagged noticeably; the financials have been hit hard on weak earnings and healthcare stocks are showing signs that they’re running on fumes after so many years of strong performance. That strong performance is probably the biggest detractor to stronger returns going forward as long term investors have serious gains to protect. Consumer defensive’s and healthcare stocks also underperformed for the week although they make up a much smaller portion of the index at a little more than 12% while high flying REIT’s make up only around 2%. (click to enlarge) (click to enlarge) (click to enlarge) (click to enlarge) For the S&P 500 to really breadth stabilize and give the market a fighting chance to making serious gains, the last need to become the first. Consumer cyclicals and industrials make up over 22% of the S&P 500 and have had…well mixed performance following tough 2014’s. And the best that can be said about energy stocks is that they haven’t gotten lot worse. This is why market prognosticators always say defensive-led rallies are doomed to failure in the long run. They make up such a relatively small part of the market that as long as they’re pulling the market higher, the advance will be tepid and unstable. Goldbugs Take Heart: What about the Yinzer Analyst’s favorite wager of 2015, European equities? Well you can see that the unhedged iShares MSCI EMU ETF ( EZU) managed a decent advance for the week although it underperformed SPY, up 1.36% to 1.66%. On a daily chart basis, the advance off a retesting of the downtrend line was confirmed by a shift in momentum and the sharp rise in the CMF (20) score although the failure to break above the 50 day moving average was disheartening. (click to enlarge) On a weekly basis, the sharp uptick in volume was offset by a middling CMF score for the week leading to a decline in the CMF 20 and failing to confirm the breakout. With Sunday’s election in Greece, the most likely direction will be lower to retest the downtrend line. (click to enlarge) Who has enjoyed a seriously strong and undeniably positive start to 2015 are the gold miners. After so many bad years, could the global uncertainty over deflation and equity weakness here at home be ready to push the miners back towards their 2014 highs? Take a look at the daily chart below, you can see the Market Vectors Gold Miners ETF ( GDX) managed to push back into its 2014 trading range before getting stuck at the 200 day moving average, but the real handicap for the week wasn’t profit taking (we hope) or covering old losses, but a positive week for the S&P 500. Despite the best efforts of the Permanent Portfolio Fund (MUTF: PRPFX ) which is killing it in 2015, gold has lost its luster for most investors and the miners especially aren’t playing a big role in their portfolios anytime soon. But hey, room to grow right? (click to enlarge) Longer term, the miners are still stuck in the falling wedge pattern that has been guiding its destiny ever downwards since 2012. This week GDX ran smack into the upper boundary and managed to push through it before running out of steam and closing below the trend line. For those gold bugs out there, take heart. Volume was lower on the week and didn’t damage the uptrend line while the MACD seems to be in the early stages of rolling over to turn positive. Even if the move turns out to be another false rally, take heart goldbugs, the pattern continues to narrow indicating a breakout could be in the cards later in 2015. (click to enlarge) That’s it for the Yinzer Analyst tonight; he’s going to need his rack time before getting up to clear some snow. But tomorrow is a new day and another change to make some money, make sure you’re ready for whichever way the market bends.