Tag Archives: function

Risk Factors Drive Lazard’s Systematic Approach To Core Investing

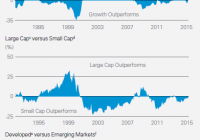
By DailyAlts Staff Core investments are those that anchor the portfolio. Typically, investors pursue exposure to broad-market benchmarks, such as S&P 500 or MSCI indexes for stocks, and the Barclays Aggregate Index for bonds, as part of their core holdings, with the intent of minimizing the unexpected. But rather than passively investing in index funds, Lazard (NYSE: LAZ ) thinks investors should take a systematic approach to implementing core investing strategies, and that is the subject of the firm’s latest Investment Focus white paper: Core Advantage: The Case for a Systematic Approach to Core Investing . The Non-Systematic Approach Managers pursuing non-systematic approaches to providing core exposure suffer from several pitfalls, first among which is the tendency for them to introduce unwanted risks to a portfolio in pursuit of benchmark-beating returns. This can happen from overweighting stocks according to style, market cap, or geographic region. While it might prove rewarding under certain market environments, it can result in outsized losses when trends unexpectedly reverse, and this is not what most investors are looking for from their core holdings. The image below shows how market favor has vacillated over time, shifting between growth and value stocks; large caps and small; and developed and emerging markets: The Systematic Approach The authors of Lazard’s paper believe the systematic approach is the best for core investing, because it allows managers to maintain stricter parameters relative to their benchmark, by ensuring against concentration according to market cap, sector, or country. Additionally, using a rules-based, data-driven, and systematic approach allows managers to analyze hundreds, even thousands of stocks within a given universe, in real-time using a bottom-up process; and to combine “robust risk management” with stock selection. How does it work? Well, according to Lazard, various risk factors have been rewarded by markets over time, including valuation, sentiment, and quality, as depicted in the image below: Valuation compares a company’s price to its peers and its own historical record, and favors companies that are inexpensive and offer long-term value. It’s a contrarian approach, and investors need to be prepared to endure short-term, unrealized losses. Sentiment is gauged by looking at the stock’s price strength, relative to the other stocks in its sector and broader benchmark, as well as analyst upgrades. In Lazard’s approach, liquidity is also taken into account by looking at volume-weighted momentum, and companies with strengthening momentum are favored while those with weakening momentum are disfavored. Quality is assessed by stability of returns and low earnings-volatility. According to Lazard, quality stocks are often those in the process of “migrating” from the realm of growth stocks to that of value. Systematic Evolution Systematic investing avoids concentrating investments in any one area and seeks to maintain a composition similar to that of its benchmark. This requires what Lazard calls an “evolving approach,” wherein investment professionals are constantly researching and testing potential improvements to the investment process. Lazard’s own approach, as implemented by the Lazard Equity Advantage team, is “uniquely positioned to help clients achieve their investment goals,” according to Lazard. “This has proved to be a solid foundation on which to build equity asset class exposure – especially through core approaches – and long-term investment program success.” For more information, download a pdf copy of the white paper .

The Joy Of Portfolio Boredom

The word boring is worth exploring further as it is a very important building block of long-term investment success. Getting rich slowly or maybe the more modest goal of getting financially comfortable slowly means some pretty plain vanilla portfolio construction. The more exciting a portfolio is on the way up, the more “exciting’ it will be on the way down. Last week I stumbled across an article that favorably critiqued an alternative-strategy ETF for being boring which is its objective. “Boring” is not the stated objective in the prospectus but terms like market neutral, absolute return, low correlation to equities and some others really are about boredom. You can judge for yourself whether a given fund that is supposed to be boring is indeed boring, as not every fund will deliver on its stated objective. The word boring is worth exploring further as it is a very important building block of long-term investment success. Ten years ago I wrote a post called Getting Rich Slowly and while I have no idea whether the phrase was a Random Roger original, I think it captures the path that most people want to take in terms of realistic participation in capital markets. Getting rich slowly, or maybe the more modest goal of getting financially comfortable slowly, means some pretty plain vanilla portfolio construction. How you get to plain vanilla probably depends on the level of engagement you want to have in markets but from the top down it should start with blending together things like equities, fixed income and a small slice to alternatives (what for years I’ve been referring to as diversifiers) with relatively simple products and/or individual issues in such a way where all three sleeves avoid trading in lockstep, but over a long period of time gives a chance for having enough money when you need it, which presumably is at retirement. As we have discussed many times before, one of the biggest impediments to long-term financial success is succumbing to emotion at the worst possible times, which can mean panic selling your portfolio at a low or repeatedly panic buying hot stocks at their highs after a pundit just extrapolated past returns on stock market television. I had the opportunity to moderate a panel that included Dr. Richard Thaler about behavioral economics/finance, and one thing he talked about as a very common bias is loss aversion, which basically means that pound for pound people feel losses far more than they feel gains. Take that out a little further and it explains why people often react to large declines like they’ve never happened before; the tendency to think this one is different. The more exciting a portfolio is on the way up, the more “exciting’ it will be on the way down. Investors of course don’t mind excitement when it is resulting in gains, but the longer it goes on, the more complacent they become in terms of forgetting the last decline or using hindsight bias to explain away the last decline. Investors don’t want boring until the market peaks out, which of course is plenty guessable but not knowable. If there is no way to know when the market will peak and losses trigger twice the emotion that gains do, then right there is the argument for boring all of the time. Again, the context for boring is not no equities but if you can buy into the idea that an adequate savings rate, proper asset allocation and not panicking are the most important determinants to long-term portfolio success then the focus shifts more in line with the true long-term objective. You are very unlikely to remember what your portfolio did in the 3rd quarter of 2013 or what the market did that quarter, without looking, because it doesn’t matter in the context of your long-term financial plan. An exception would be if that was the quarter you retired. The only other way some random calendar quarter from your past is likely to matter is if you made some sort of catastrophic mistake like selling out in the first quarter of 2009. The conclusion for me is a diversified portfolio of equities that at the very least offers decent upside participation, fixed income exposure that offers some ballast to normal equity volatility and a little exposure to diversifiers, as I said above, that hopefully allows for managing volatility and correlation such that the potential for panic is at least partially mitigated. Disclosure: I/we have no positions in any stocks mentioned, and no plans to initiate any positions within the next 72 hours. (More…) I wrote this article myself, and it expresses my own opinions. I am not receiving compensation for it. I have no business relationship with any company whose stock is mentioned in this article. Additional disclosure: To the extent that this content includes references to securities, those references do not constitute an offer or solicitation to buy, sell or hold such security. AdvisorShares is a sponsor of actively managed exchange-traded funds (ETFs) and holds positions in all of its ETFs. This document should not be considered investment advice and the information contain within should not be relied upon in assessing whether or not to invest in any products mentioned. Investment in securities carries a high degree of risk which may result in investors losing all of their invested capital. Please keep in mind that a company’s past financial performance, including the performance of its share price, does not guarantee future results. To learn more about the risks with actively managed ETFs visit our website AdvisorShares.com .

TYNS Is An Inferior Inverse Bond ETF

Summary TYNS has very low AUM. TYNS is very illiquid. TYNS charges a fee that siphons off returns. Over the last month I have written extensively about inverse bond ETFs. Not all inverse bond ETFs are made equally though, so my goal is ultimately to dissuade investors from choosing low quality ETFs when there are superior options on the market. I believe we are in an economic environment unavoidably poised to experience rising interest rates. Inverse bond ETFs can be used shrewdly to capitalize on this market inevitability. Also, they can be used as hedging tools for bond heavy portfolios. However, there is long list of risks associated with investing in an inverse bond ETF, and it is prudent to research and analyze each security before investing. I believe inverse bond ETFs are valuable resources; however, it is important to know which inverse bond ETFs are the best in order to maximize returns. The Direxion Daily 7-10 Year Treasury Bear ETF (NYSEARCA: TYNS ) is inferior to the Proshares 7-10 Year Treasury ETF (NYSEARCA: TBX ) because it has very little assets under management, extremely low daily volume, and very average spreads. What Makes an Inverse Bond ETF Bad? When evaluating an inverse bond ETF it is important for an investor to look for one that is traded heavily and correlates well to its underlying index. The three most important metrics for determining the quality of an inverse bond ETF are liquidity, expense, and assets under management. A good inverse bond ETF has a low expense ratio, is highly traded, and maintains assets with wide coverage. A bad inverse bond ETF does just the opposite. Another metric that ought to be considered is the strength of the underlying institution that issues the inverse bond ETF. If underlying institution cannot honor the investment, an investor stands to lose everything. Another factor that ought to be considered is the inverse bond ETF’s multiplied leveraged. Inverse Bond ETFs come in three sizes: 1X, 2X and 3X . 2X and 3X ETFs are designed to multiply the daily returns (or the inverse returns) of the performance of an underlying index. 1X ETFs follow the daily returns of its underlying index one for one. Since 3X inverse bond ETFs multiply daily returns by three times, the risks already associated with inverse bond ETFs are exacerbated exponentially. Compounding risk greatly affects returns of 3X ETFs particularly when tracking range bound indexes. TYNS Analysis The Direxion Daily 7-10 Year Treasury Bear ETF provides inverse exposure to a market-value-weighted index of U.S. Treasury bonds with remaining maturities between 7 and 10 years. TYNS provides daily inverse -1X exposure to the NYSE 7-10 Year Bond Index. The index is designed to rise when interest rates rise and bond prices fall. TYNS is a bet on rising yields. With the eventuality of rising rates, TYNS theoretically ought to perform well. TYNS has a net expense ratio of 0.65% which is a management fee that diminishes returns. TYNS only has 1.55 million assets under management which is pathetically outmatched by TBX which has 40.2 million AUM. The lack of AUM essentially renders TYNS useless for investing purposes. Finally, TYNS has daily volume of 1,846 compared to TBX which has daily volume of 9,672. TYNS has tons of liquidity risk, and TYNS has such a low AUM that it is an unreliable investment for all but the smallest investors. TYNS Graph I included a graph of TBX, TYNS, and 10 Year yields to visually show the horrible amounts of daily tracking error inherent with an illiquid ETF like TYNS. TBX clearly tracks daily volatility in 7-10 year yields than TYNS. Conclusion It is painfully obvious that TBX is superior to TYNS in almost every way. The only metric TYNS was better than TBX in was its expense ratio. TBX had an expense ratio of 0.95% compared to TYNS’s 0.65%. However, the higher expense is completely worth it for owning a tradeable, correlated, and liquid inverse bond ETF. Disclosure: I/we have no positions in any stocks mentioned, and no plans to initiate any positions within the next 72 hours. (More…) I wrote this article myself, and it expresses my own opinions. I am not receiving compensation for it (other than from Seeking Alpha). I have no business relationship with any company whose stock is mentioned in this article.