Tag Archives: function

A 13.7% Yield From GreenHunter Resources Preferred Shares

GRH’s oilfield waste water disposal business is running at full capacity and expanding rapidly despite low oil and natural gas prices. GRH-PC is a cumulative preferred issue that now yields 13.7%. Gary Evans has successfully built valuable midstream assets at MHR and is doing the same thing at GRH. GreenHunter Resources (NYSEMKT: GRH ) was initially formed by Magnum Hunter founder Gary Evans with the goal of developing alternative energy sources. The company soon realized that biomass and other “green” energy technologies were unprofitable and has exited that business. GRH is now focused on developing cost effective and environmentally friendly oilfield fluid management solutions. GRH-PC is a par $25 cumulative preferred convertible issue. GRH-PC has a 10% coupon and dividends are paid monthly. It now yields 13.7% at a recent price of $18.25. See prospectus for additional details. GRH-PC dividends were classified as Return of Capital for 2014, which provides some tax advantages. ROC dividends lower your cost basis, but are not taxable as income when received. Given that GRH has accumulated substantial tax losses, GRH-PC dividends are likely to remain ROC for quite some time. Why is GRH’s oilfield waste water disposal business running at full capacity (turning away business in fact) even with low oil and natural gas prices? GRH initially developed operations in several regions, but made the wise strategic decision to focus on Appalachia. Disposal wells in other regions were sold and equipment was moved. This resulted in lower Q1 revenues, but paves the way for future profitable growth. Appalachia is a region where the permitting of disposal wells is a difficult and lengthy process. Waste water must often be trucked for long distances at high cost to be properly disposed of. The scarcity of attractively located disposal wells and the difficulty in building more is a key competitive advantage for GRH. Many GRH customers have signed “take or pay” contracts. They are required to pay for access to the company’s disposal capacity, even if they don’t actually use it. GRH serves customers in the Utica and Marcellus fields. These are among the best fields with the highest returns on drilling. Drilling reductions have been less severe for the Utica and Marcellus fields than for other regions with higher production costs. GRH is doing some innovative things that are years ahead of its competitors. Several new disposal wells are coming online over the next few months that are expected to increase their water disposal capacity by about 50%. These wells are being connected to a central offloading terminal by a network of wastewater pipelines. This is an extremely efficient system that will give GRH a significant cost advantage. GRH has also been building a network of barging terminals along the Ohio River and expects to start barging waste water to their central disposal terminal later this year. Barging is a great solution for the pollution and traffic problems associated with trucking. Note that barges are already being used to transport oil and other cargos that are far more hazardous than oilfield water. GRH estimates that barging is about 25% cheaper than trucking. Ironically, barging has been opposed by some “environmentalists.” Some extremists believe we should shut down virtually all oil and natural gas production, but this is just not practical. GRH is developing the right infrastructure for the safe, cost effective and environmentally friendly disposal of waste water. What are the advantages of owning the GRH-PC preferred stock as compared to the GRH common stock? While GRH is building some unique and valuable midstream assets, it’s been a painful growth process for common stockholders. Preferred holders have continued to receive generous monthly dividends while the GRH common has been diluted to raise additional capital. The preferred dividend was maintained even when cash got extremely tight. Fortunately liquidity has improved greatly as GRH closed a new $16 million secured credit facility on 4/15/2015. Cash flow has been challenging for GRH, but should also improve dramatically over the next few quarters as new disposal wells and barging come online. GreenHunter Resources was founded by Gary Evans and he controls a majority of the GRH common stock. The preferred stock is senior to the common stock, so it’s comforting to know that insiders have such a large stake in the company. Gary Evans is better known for founding Magnum Hunter Resources (NYSE: MHR ). MHR also has a strong record of continuing to pay preferred dividends even when liquidity gets tight ( see my recent MHR article ). The MHR preferred issues rallied when MHR announced plans to sell some of their midstream assets for $600 million-$700 million. Many of my newsletter subscribers (see additional article disclosure) are long-time investors in the MHR preferred issues and were not surprised to see Gary Evans come through. GRH-PC is a smaller issue and is not nearly as well known as the MHR preferred issues. Gary Evans has already shown a knack for building valuable midstream assets at MHR and appears to be doing it again at GRH. MHR preferred stock investors should consider the “other” Gary Evans yield play. Editor’s Note: This article covers one or more stocks trading at less than $1 per share and/or with less than a $100 million market cap. Please be aware of the risks associated with these stocks. Disclosure: I am/we are long GRH-PC,MHR-PD. (More…) I wrote this article myself, and it expresses my own opinions. I am not receiving compensation for it (other than from Seeking Alpha). I have no business relationship with any company whose stock is mentioned in this article. Additional disclosure: The author is the publisher of the Panick Value Research Report. The Panick Report is focused on high yield preferred stock issue, email mrpanick@yahoo.com for the 2 week free trial.
The ProShares USD Covered Bond ETF: Covering All The Bases

One of the few ways for a retail investor to participate in the covered bond market. The fund features U.S. Dollar denominated AAA rate covered bonds. The fund is actively managed, with total annual expenses of 0.35%. Anyone who knows the game of baseball will tell you that in order to play effective defense, the team must know how to keep the bases covered at all times. It’s not as simple as it sounds. It depends on the baserunners, on what bases and then what to do on the next pitch. Covering all the bases carries over to investing and choosing a fund while keeping that well-worn baseball axiom in mind. According to European Covered Bond Council : …Covered bonds are debt instruments secured by a cover pool of mortgage loans (property as collateral) or public-sector debt to which investors have a preferential claim in the event of default… In other words a covered bond is a bond whose cash flow originates from other bonds or loans called a ‘cover pool’. This might remind some investors of the infamous ‘collateralized’ or ‘securitized’ mortgage backed securities, but covered bonds are not that. First, a covered bond is not an ‘off-balance-sheet’ asset. It is an obligation kept on the balance sheet of the issuer; it is a ‘bond’ in every way. The issuer bears full accountability for the bond and the payments. In other words, the bondholder has full recourse to the issuing credit institution, if need be. Second, the bondholder also has a claim to the covered pool, senior to unsecured creditors. Third, it is the responsibility of the issuer to maintain sufficient assets in the cover pool to satisfy the claims of bondholder during the life of the bond. Lastly, to be able to issue a covered bond, the issuing institution must be an accredited, regulated institution. What it amounts to is that all the bases are covered. At this point, it’s necessary to mention a little known general fact about bonds: a bond may be issued in a currency other than the issuer’s sovereign currency. So, for example, an accredited, regulated European institution may issue U.S. Dollar denominated bonds , even if the native currency is the Euro. There are various reasons for this. For example, a U.S. Dollar denominated bond might be intended for a particular segment of the U.S. market; a pension fund for instance. Also, advanced economy nations may issue foreign denominated bonds as part of a trade agreement. This is particularly true of emerging market nations trying to attract foreign, fixed capital investment. Most importantly, a foreign denominated bond is a hedge against originating currency volatility. One other critically important characteristic of this fund is that does not choose yield over risk. ProShares USD Covered Bonds ETF, ” focuses exclusively on the highest rated U.S. Dollar denominated bonds ” and ” is the only corporate bond fund in the United States with substantially all of its assets rated AAA. ” Thus the fund has an added measure of safety in a financial world rife with unsound fixed income investments. The fund first traded in May of 2012 and has been consistent on returns with a steady Net Asset Value as well as a steady flow of monthly distributions. (click to enlarge) The average dividend return for 2012 was $0.085491 per month for the 7 months of the fund’s inception year. In 2013 the average dividend was $0.0821472 per month; in 2014 it was $0.0847515 per month and for 2015 $0.0930747, to 7/1/15. Hence the dividend has been consistent since inception. The average NAV since inception is $101.42368 and the June 19 NAV close $101.53, hence about 0.108% above its average and 1.53% above its inception value. The dividends paid since inception total $3.159669 on the $100.25 per ETF share, or 3.1517895%, if purchased on the inception date. This is in comparison with the 3 year U.S. Treasury note’s 0.41% and the 30 year U.S. Treasury bond’s 2.80% secondary market yields on the fund’s inception date of 5/21/2012. Hence this fund with its AAA, rating had a better yield, to date, than a 30 Year U.S. Treasury bond if purchased on the same date. (click to enlarge) Dividend Distributions chart: data from ProShares The ETF market shares have returned -1.546% since inception, as of the June 29, 2015 close. This means that, currently, the market shares are trading well below the NAV, meaning the shares are selling at a 2.67% discount to the NAV. This is a rare event. The share price has traded at a discount on only 40 of the 785 days since inception or 3.82% of the time. It has traded at a premium on 96.13% or 745 days over the life of the fund. It’s possible that the ETF shares are selling at a discount to the NAV on expectations that the U.S. Fed is expected to tighten. If this is the case, the investor must consider the U.S. Feds plan to raise by small increments. The Maturity Distribution Chart demonstrates that the largest portion of the covered pool, 55%, is held in 2 to 4 year bonds, and 34% in 0 to 2 year bonds. Since the fund is actively managed , the higher likelihood it will anticipate and adjust quicker than a rules based passively managed fund. It is interesting to note the fund’s performance during the global bond selloff from about the middle of April until the beginning of June. The NAV closed at a high of $102.10 on April 15, paid a dividend of $0.087976 on May 11, $0.101797 on June 9 and closed at a low of $101.04 on June 10, averaging 101.57, or about $0.15 above its average since inception. The average dividend paid was $0.09489, $0.01274 above its average since inception. The ETF share price closed at a high of $102.15 on April 22 and closed at a low of $99.39 on June 8 a decline 2.70%, or $2.76 from the April high. Most recently, the ETF shares closed at $98.70 on July 1, while its calculated NAV as of July 1, was $101.41. It’s important to note then, the market shares are trading well below the NAV, a discount of -2.67%. This is a rare event. The share price has traded at a discount on only 30 of the 740 trading days since inception or 4.05% of the time. It has traded at a premium on 95.95% or 700 trading days over the life of the fund. There are currently 25 covered bonds in the fund, and a cash position of $48285.95. The weighted average yield to maturity is 1.48%. The trailing twelve month yield is 1.06% and the annualized yield based on the last distribution is 1.18%. The fund’s net assets as of June 19 are $6.563 million. It’s worth noting that the tracking index is comprised of 44 issues, has a weighted average maturity of 3 years, a weighted average yield to maturity of 1.52%. This indicates that this actively managed fund is more efficient than the unmanaged index. Almost all of the covered bonds are “144A” bonds. Investopedia defines SEC Rule 144A a modification of: … a two-year holding period requirement on privately placed securities to permit qualified institutional buyers to trade these positions among themselves … In other words, the rule creates a more liquid market for these securities. The fund’s largest holding is Australia’s Westpac Banking Corp (NYSE: WBK ) 144A 1.850% due 11-26-18. According to Westpac, its covered bond rating by Fitch is AAA and by Moody’s, Aaa. Just as a side note, a Seeking Alpha contributor Donald van Deventer recently updated his analysis of Westpac Banking Corporation noting that: … Westpac Banking Corporation has continued to be a prominent bond issuer in international markets… The bank ranks in the safest 10% of the world-wide banking peer group for default probability maturities of 5 years or more, but the banking sector is a risky one … The second largest market value holding is The Royal Bank of Canada’s (NYSE: RY ) 144A 2% due 10/1/18. Moody’s rating of the bank’s covered bond program is Aaa and Fitch ranks it at AAA. SpareBank ( OTC:SRMGF ) is a Norwegian Bank which, coincidentally, specializes in covered bond issuances. The cover pool consists of high quality single family residential mortgages. It must be emphasized that these are not securitized or collateralized off-balance-sheet debt instruments, but actual bonds for which the issuer bears full responsibility. Further, in the aftermath of the global credit bubble, the financial and legal consequences suffered by the rating agencies served to strengthen the quality of analysis and that of ratings. SpareBank 1 Boligkreditt mortgage-cover-pool, covered bonds, are rated Aaa by Moody’s and AAA by Fitch. Stadshypotek AB , is a Swedish mortgage lender and subsidiary of Svenska Handelsbanken ( OTCPK:SVNLY ), whose covered bond program receives an Aaa rating from Moody’s. Since it is a subsidiary, it should be noted that S&P rates the issuer Stadshypotek AA-; Fitch AA-, and lastly Handelsbanken receives ratings of AA- from S&P, Aa3 from Moody’s and AA- from Fitch. ING Groep (NYSE: ING ) of Netherlands, has a global reach but is mainly a European based bank. Their 144a 2.625% coupon, due 12/5/2022 receives Aaa from Moody’s, AAA from S&P and AAA from Fitch. ING’s ‘hard-bullet’ covered bonds are backed by Dutch Prime Residential Mortgages, the Dutch legal standard for mortgage cover pools. Covered Bond ETFs are a rarity in the ETF universe. iShares offers an investment grade , Euro denominated, Covered Bond ETF (ICOV.LN). The returns on the holdings are better, but the description refers to ‘ investment grade ‘ investments, meaning BBB or higher. Lastly, U.S. based Pimco in cooperation London based Source also markets a covered bond ETF (COVR:XTER) however it trades on the German DAX and in Euros. To some up, the ProShares USD Covered Bonds ETF (NYSEARCA: COBO ) offers investors a way to participate in an asset class not accessible to individual retail investors. Further, the fund has a strong bias towards highly rated covered bonds with the best possible yields. Further, the high rating bias extends to the ‘cover pool’ of securities. The fund’s performance during the recent global bond market correction demonstrated its stability. The ETF shares did lose value but the Net Asset Value of the fund remained well within its long term deviation, thus creating a discount arbitrage for the shares vs the NAV. According to the prospectus , the fund is actively managed by ProShares Advisors and the total fees, expenses waivers and reimbursements result in total operating expenses of 0.35%. If it’s expected that low rates of return are to be the new normal, this may be a good opportunity to earn surprisingly good returns and very high degree of safety. Disclosure: I/we have no positions in any stocks mentioned, and no plans to initiate any positions within the next 72 hours. (More…) I wrote this article myself, and it expresses my own opinions. I am not receiving compensation for it (other than from Seeking Alpha). I have no business relationship with any company whose stock is mentioned in this article.

Calpine Corporation’s Price Decline Is Unwarranted

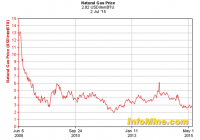
Summary The company’s long-term story remains unchanged and highly favorable. The recent sell-off likely the result of sector rotation out of utilities. I increased my exposure to the shares by 50%. Calpine Corporation (NYSE: CPN ) shares have gotten pummeled in recent months and now sit at 52 week lows near $17.50/share. Shares are down significantly since I first recommended the company on Seeking Alpha back in February of 2015 , but I still maintain a long-term bullish outlook. This is one company that I agree with sell-side analysts on and I’ve been vigorously beating the drum in favor of. In my opinion, there isn’t a company better positioned for macro trends in United States energy production over the next ten-twenty years than Calpine. This is a shame as retail investors have shunned the company, with the almost all of the shares held by insiders or institutions. This is woeful compared to peers and I think retail investors are turning a blind eye to the company’s prospects for capital appreciation. The lack of a dividend, as opposed to the company’s share repurchase plan, in my opinion is the single biggest obstacle that retail investors need to get over when considering an investment here. Especially for tax-advantaged accounts, Calpine can give utility-sector exposure to improve account diversification while simultaneously providing an excellent growth vehicle long-term. Long-Term Tends Remain Intact Increasingly stringent environmental regulations in the United States are not going away anytime soon, despite heavy lobbying from the coal industry and some outdated utility players. 63% of Americans now believe in climate change according to a recent Yale study on the subject. Such a large voting bloc can’t be ignored going forward and any attempts to strip down/repeal current EPA mandates are likely to be met with fierce voter opposition. Unfortunately the facts remain that America’s coal fleet is incredibly old; the average coal-fired power plant was constructed in the 1970’s. Bolt-on fixes to reduce greenhouse gas emissions on these plants are going to become increasingly more expensive and subject to diminishing returns. On the same coin, new construction of coal plants, which are highly capital intensive and require decades for payoff, are unlikely in the current regulatory environment regulating CO2 and other gases. Likewise, we aren’t shutting off coal and switching to wind/solar/hydroelectric overnight. We simply don’t have the technological capacity or the investable capital to meet our current energy needs with these processes yet. Renewable energy’s share of power generation is highly likely to continue growing quickly over the coming years, but the time when renewables constitute the majority of American power generation is likely many decades away. * Historical natural gas price chart 2008-2015 By comparison, plants fired by natural gas, which constituted 95% of Calpine’s power generation in 2014, are set to the biggest beneficiaries of the production switch. Cheap natural gas from the American shale revolution likely isn’t going away anytime soon and will continue to be an amazing source of cheap power input for natural gas plants. While fracking is also a highly contentious environmental issue, opinion is more divided here than with opinions on the coal industry and climate change and may be symptomatic of a lack of understanding of the process rather than the actual science behind it. A federal ban or hamstringing regulation is highly unlikely at this point and states where fracking occurs are treading carefully given the boost the process has given local economies. Reducing Debt, Freeing Up Cash flow Calpine holds a stigma after dealing with a bankruptcy in 2005. Natural gas prices were sky-high, competition was stiff with new plants coming online the company’s markets, and the company’s $22B debt load was simply unsustainable. The company now has more assets than it did pre-bankruptcy and the debt load much smaller at $11.84B, so investors should not have little fear of a repeat. * Calpine Investor Presentation Additionally, average yearly interest expense has come down significantly during this timeframe, saving the company hundreds of millions over the past few years as the company takes advantage of the low interest rate environment. As the debt comes down over the next few years, this frees up capital for the company to continue to purchase shares at an elevated rate or invest in new acquisitions that will generate substantial additional earnings (like the Fore River purchase from Exelon in August of 2014). 1Q 2015 Results, Rest-Of-Year Outlook First quarter was in-line with management guidance. This sported a tough year/year comparable because of the polar vortex, which provided an extremely healthy boost to first quarter results last year (adjusted EBITDA in the east region was down from $269M to $125M y/y). Of note is management’s reaffirmation of 2015 adjusted EBITDA (basically EBITDA plus debt extinguishment, one-off maintenance, operating leases, and stock-based compensation) of $1.9-2.1B. For investors used to EBITDA, EBITDA is forecast to be $1.5-$1.7B. This places estimates of 2016 EV/EBITDA firmly in the 10-11x range, which is honestly in-line with broader market peers. The difference here is this is severely discounting Calpine’s advantages. Its fleet is young (average plant age of 14 years), giving the company an advantage over aging peers. As we’ve noted, it has no projected expensive regulatory overhang from EPA emission mandates. It operates in some of the strongest power markets in the United States (California, Texas, and the Northeast). Of note are the share repurchases. Total spent on repurchases totaled $236M through 4/30/15. Pushing this through the rest of the year (although perhaps management may elevate purchases due to lower prices at current levels) and it is likely that Calpine will retire $700M+ worth of shares at current rates. If prices remain at current levels, this could end up retiring 10%+ of the float in one year, just from free cash flow (free cash flow for 2015 is projected at between $800-$1B). Conclusion Calpine remains a strong buy and I’m unsure of what has driven the current selloff other than sector rotation, which has been a driving theme of 2015 as utilities have swung out-of-favor due to the impacts of a looming fed rate hike, which impacts utilities in regards to value of the dividend yield (no impact on Calpine as it pays no dividend) and the possibility of higher interest costs (approximately 50% of Calpine’s debt is variable rate, generally tied to LIBOR + a fixed rate). Most investors would be well-suited to include Calpine in their investments, especially younger investors that have a long timeframe to allow the secular trends to play out in the company’s favor. Even short-term traders may be interested, given the company is going to perform strongly in the back half of the year where it traditionally has not, giving the company an opportunity to trounce year/year comparables. Disclosure: I am/we are long CPN. (More…) I wrote this article myself, and it expresses my own opinions. I am not receiving compensation for it (other than from Seeking Alpha). I have no business relationship with any company whose stock is mentioned in this article.