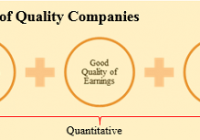
This article is based on the working paper we published on ssrn. The working paper can be accessed by clicking here . The risk of paying too high a price for good quality stocks – while a real one – is not the chief hazard confronting the average buyer of securities. Observation over many years has taught us that the chief losses to investors come from the purchase of low quality securities at times of favourable business conditions. – Benjamin Graham It’s far better to buy a wonderful company at a fair price than a fair company at a wonderful price. – Warren E. Buffett As the above two quotes reflect, the idea of buying high quality stocks has been around for quite some time. However, it has gained renewed momentum over the past few years driven by spectacular crashes experienced subsequent to the technology boom and during the global financial crisis. This is also reflected in academic research. Over the last few years, several academics have weighed in on the quality factor and many papers have been written trying to identify criteria for defining high quality stocks. Further, as it is becoming widely accepted as an anomaly, quality is now being designated by many researchers as a fifth factor explaining investment returns in addition to the four widely accepted factors, namely beta, size, momentum, and value. This development is in sync with our long held belief that quality is a distinct investment style. This paper is related to a large literature as a number of studies have explored returns to factors such as profitability, relationship between accounting and economic profits, and leverage. Robert Novy-Marx (2013) showed that stocks with high gross profitability as measured by gross profits to assets, outperform. Chan, et. al. (2006) shows that difference between accounting earnings and cash flows is negatively associated with future returns. George and Hwang (2010) shows that stocks with low leverage have high alpha. In this paper, we discuss the investment returns of a simple quantitative process from selecting high quality stocks. We believe that in valuing high quality stocks, market participants systematically underestimate the duration of competitive advantage such that the valuation premium assigned isn’t sufficient to account for the difference between the business value creation potential of a high quality business as compared to the average business. Indeed, a basket of high quality stocks generates significantly superior investment returns compared to publicly traded benchmarks and does so with significantly lower risk. Section 1. High Quality Stocks – The Multi-Act Way At Multi-Act, we have spent in excess of fifteen years developing and perfecting our process of identifying high quality stocks. Our internal research process assigns every company followed by us a quality rating, referred to as ‘Grade’. There are several components of our process some of which lend themselves to quantitative modelling while others don’t. A crucial component of our classification of a business as high quality is the existence of “sustainable” competitive advantage, a component that does not lend itself to quantitative modelling. It is important to note that the existence of competitive advantage and sustainability of this competitive advantage are the most important criteria in our classification of a business as quality. This is driven by our assertion that much of the investment returns that accrue to investors from quality factor depend on the ability of the business to persist with its supernormal returns on capital which in turn depends on its ability to keep competition at bay. Given our inability to model this component, we believe that our manually selected list of quality businesses will likely generate superior risk-adjusted performance as compared to the quantitatively selected basket that is discussed here. Section 2. Quality Factors There are some key characteristics of a high quality business. A high quality business generates superior returns on capital – stronger the competitive advantage, lesser the impact of competition, higher the returns on capital. Returns on capital of such businesses tend to be persistently fat. Further, such businesses have a very healthy relationship between their accounting profits and their economic profits. Finally, we like our high quality businesses to possess good balance sheets such that financial risk isn’t a significant factor driving our investment returns or risk. Source: MAEG As shown in Exhibit 1, Multi-Act’s process of classification of a business as a high quality business includes three characteristics that lend them to quantitative analysis. Note that our research process utilizes a multiplicity of measures within each characteristic. However, for the sake of simplicity, we have chosen one measure to represent each quality characteristic. For the purposes of this paper, we measure returns on capital by return on equity (RoE). Fat return on equity indicates existence of competitive advantage and the persistence of this variable suggests sustainability of the competitive advantage. It is important to keep in mind that it is possible for the management of a company to manage its return on equity. To the extent that earnings are manipulated, they will impact return on equity as well. Further, return on equity is also affected by corporate transactions including buybacks, acquisitions, restructuring, etc. To ensure that the earnings component of the return on equity is not a result of financial creativity, we use a quality of earnings factor namely free cash flow over earnings (FCF/EPS). Over the years, we have found that this measure helps us filter out companies with suspect accounting numbers. Finally, we measure financial safety by net debt over free cash flow (ND/FCF). This measure indicates the number of years of free cash flow that is needed to repay the debt. Table 1 provides summary statistics on each of the quality factors by country. Section 3. Data and Quality Factors Data Sources Our data sample consists of 5,262 companies covering 23[1] countries between 1997 and 2013. The 23 markets correspond to countries contained in the MSCI World Developed Index as of December 31, 2013. All data including fundamentals and price data are from Factset Global data feed with returns calculated in USD with currency risk hedged away. We utilize fundamental data reported anywhere in calendar year t-1 in April of calendar year t such that there is a minimum of three month lag from the end of the fiscal year of the company. Table 2 provides summary statistics on number of companies and market capitalization by country. Since the cash flow data is available from 1989 and some of our fundamental variables require minimum five-year data availability, our sample could start at the earliest from 1994. However, given the limited number of companies which satisfied our data requirements, our model starts from 1997. Section 4. Methodology Before proceeding with our calculations, we perform two exclusions, firstly for size and secondly for suitability and data applicability. We exclude all companies with market capitalization less than USD 1 billion. This number is deflated at 6% p.a. for years prior to 2013. The objective of this exclusion is to minimize size factor’s contribution to our investment returns. Further, we exclude some industries that in our assessment do not lend themselves to existence of sustainable competitive advantages[2]. This is not to say that there cannot be a business with sustainable competitive advantage in these industries. However, it is our assessment that the probability of finding a business with sustainable competitive advantage in these industries is significantly lower. Further, calculating cash flow data presents a practical problem with some of these industries, especially in the case of banking and insurance businesses where cash flow is affected by changes to loans, investments, and deposits and thus loses its sanctity. Accordingly, we have excluded these industries from our samples. We calculate quality factors discussed earlier for all the remaining stocks in our data sample. We then apply absolute cutoffs, levels that a business must meet in order to qualify as a high quality business. Businesses that meet these cutoffs are then sorted by their market capitalization in a descending order. Finally, we select fifty of the largest businesses from all qualifying businesses as our quality basket. Using the characteristics above, we create a basket of fifty high quality stocks every year and test the performance of the basket so created over a period of seventeen years, from 1997 to 2013. Section 5. Risk and Returns of the Quality Basket We now turn our attention to risk and returns of high quality stocks. Figure 1 shows the performance of the high quality stocks basket on a net basis[3] as compared to that of MSCI World Developed market index. Given that we selected our high quality stocks basket from a universe of all companies from developed markets, we consider this index to be the appropriate benchmark. The high quality stocks basket generated compounded annual return of 7.4% as compared to 4.3% for MSCI World Developed index. What is more, annualized standard deviations of monthly returns were lower for the high quality stocks basket at 12.6% as compared to 16.1% for the benchmark index. Over the same time frame, S&P 500 generated returns of 5.3% p.a. with annualized standard deviation of 15.8%. (click to enlarge) High Quality Stocks – Investment Returns to Quality, Net Figure 2 shows performance of the high quality stocks basket on a gross basis[4] as compared to that of the benchmark index. The high quality stocks basket generated compounded annual return of 9.4% as compared to 6.6% for the benchmark index. The annualized standard deviations of returns were lower for the high quality stocks basket at 12.7% as compared to 16.1% for the benchmark index. Over the same time frame, S&P 500 generated returns of 7.3% p.a. with annualized standard deviation of 16.0%. (click to enlarge) High Quality Stocks – Investment Returns to Quality, Gross Figure 3 shows drawdown[5] profiles of the high quality stocks basket and of the benchmark index. Clearly, the high quality stocks basket is significantly less risky when compared to MSCI World Developed index as drawdowns aren’t only shallower; recovery to peak is quicker as well. We estimate the high quality stocks basket’s relative risk to be 55%[6] of that of the benchmark index. (click to enlarge) High Quality Stocks – Drawdowns for High Quality Stocks Section 6. Risk and Returns of MAEG’s “Manual” Quality Basket As stated earlier, a key component of our high quality stocks selection process does not lend itself to modelling. In this section, we analyze performance of our actual quality basket, a basket that has to pass through our human analytical rigor as well as our systematic process. We refer to this basket as the 100% list. Figure 4 shows performance of the 100% list of high quality stocks on a net basis[7] as compared to that of the benchmark index. The 100% list of high quality stocks generated compounded annual return of 13.5% as compared to 4.3% for benchmark index. The annualized standard deviations of returns were lower for the 100% index of high quality stocks at 14.8% as compared to 16.1% for the benchmark index. Over the same time frame, S&P 500 generated returns of 5.3% p.a. with annualized standard deviation of 15.8%. $100 invested in April of 1997 in MAEG’s 100% index of high quality stocks would have grown to almost $883 by June 2014 as compared to $206 in MSCI World Developed Index and $245 in S&P 500 Index. (click to enlarge) High Quality Stocks – Investment Returns to MAEG’s High Quality Index, Net Figure 5 shows drawdown profiles of the 100% index of high quality stocks and of the benchmark index. Clearly, the 100% Index of high quality stocks is significantly less risky when compared to MSCI World Developed index as drawdowns aren’t only shallower; recovery to peak is quicker as well. We estimate the quality basket’s relative risk to be 57% of that of the benchmark index. (click to enlarge) High Quality Stocks – Drawdowns for MAEG’s High Quality Index Summary Multi-Act’s definition of high quality stocks includes quantitative as well as qualitative variables with sustainability of competitive advantage being a key factor. A simple three factor quantitative process for selecting high quality stocks outperforms the publicly traded benchmarks and does so with lower risk. MAEG’s manually selected list of high quality stocks – 100% Index – generated substantially superior performance even when compared to the performance of quantitatively selected high quality stocks. Table 1. Comparison of Quality Measures This table shows average quality measures by country for the investment universe as well as for the quality basket. Each year, we calculate averages for the three quality measures for the investment universe selected after making size-based and industry-based exclusions and for the quality basket comprised of fifty stocks. We utilize fundamental data reported anywhere in calendar year t-1 in April of calendar year t such that there is a minimum of three month lag from the end of the fiscal year of the company. This table reports the average of each year’s equal-weighted average of quality measures between 1997 and 2014. High Quality Stocks – Countrywise Quality Factors Table 2. Number of Companies and Market Capitalization This table shows yearly average of total number of companies and yearly average of market capitalization for the investment universe as well as for the quality basket, by country. High Quality Stocks – Descriptive Statistics References Novy-Marx, Robert (2013), “The Other Side of Value: The Gross Profitability Premium,” Journal of Financial Economics Chan, K., Chan, L.K.C., Jegadeesh, N., Lakonishok, J. , (2006), “Earnings quality and stock returns,” Journal of Business George, Thomas J., and C.Y. Hwang (2010), “A Resolution of the Distress Risk and Leverage Puzzles in the Cross Section of Stock Returns,” Journal of Financial Economics [1] The countries included are Australia, Austria, Belgium, Canada, Denmark, Finland, France, Germany, Hong Kong, Ireland, Israel, Italy, Japan, Netherlands, New Zealand, Norway, Portugal, Singapore, Spain, Sweden, Switzerland, United Kingdom, and United States. [2] Following industries were excluded for the purposes of this paper: Aluminum, Steel, Pharmaceuticals: Generic, Pharmaceuticals: Major, Pharmaceuticals: Other, Financial Conglomerates, Investment Banks/Brokers, Life/Health Insurance, Major Banks, Multi-Line Insurance, Property/Casualty Insurance, Real Estate Investment Trusts, Regional Banks, Specialty Insurance, Biotechnology, Apparel/Footwear Retail, Major Telecommunications, Electronics/Appliance Stores, and Specialty Stores. [3] Excluding dividends. [4] Inclusive of dividends. [5] The peak-to-trough decline during a specific record period of an investment, fund or commodity. A drawdown is usually quoted as the percentage between the peak and the trough. (Source: Investopedia) [6] Worst drawdown of the quality basket is 35% while that of the benchmark index is 54%. The relative risk is estimated as log(1-35%)/log(1-54%) = 55%. At 55% of the benchmark’s risk, relative risk of the quality basket is about half that of the benchmark index. What this means is that it takes about two back-to-back losses of 35% to produce one 55% loss. For more on this, refer http://www.hussmanfunds.com/wmc/wmc141013.htm [7] Excluding dividends.