Scalper1 News
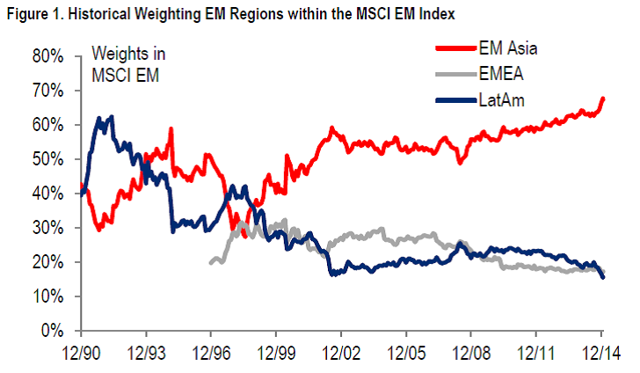
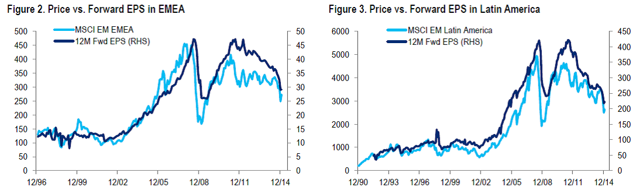
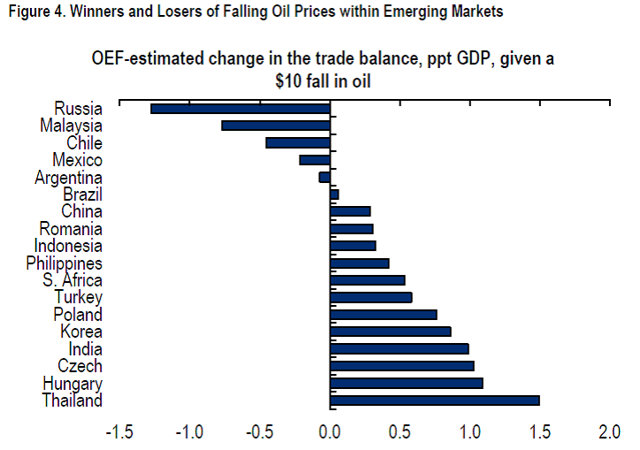
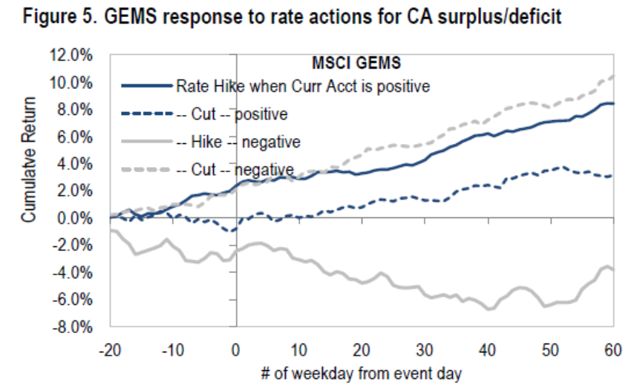
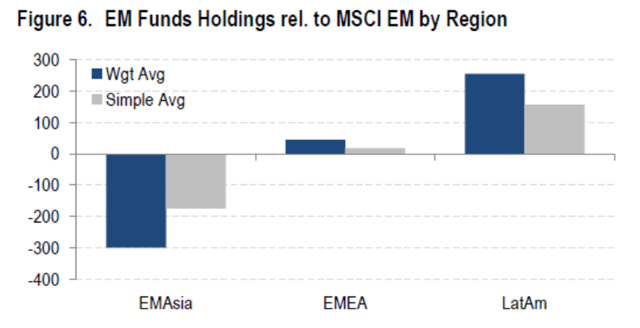
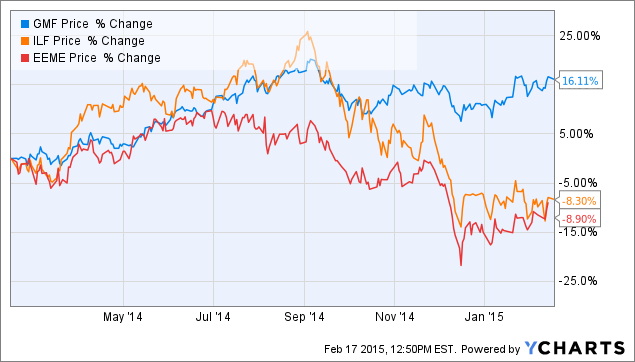 I sense a strong desire to buy LatAm given valuations. I would restrain that desire though. While Asia’s earnings are growing, LatAm’s are still in recession terrain. Investors are overweight LatAm over Asia still. A contrarian view will suit investors well. LatAm’s weighting has been reduced substantially among emerging markets to a low of 15% ( Figure 1 ). This is the lowest level since 1990. Some would suggest overweighting LatAm (NYSEARCA: ILF ) vs. Asia (NYSEARCA: GMF ). I disagree, and LatAm remains my largest underweight. (click to enlarge) The time for recovery will arrive for EMEA (NASDAQ: EEME ) and LatAm, but not yet (see figures 2 and 3). Earnings wise, LatAm and EMEA remain in recession. When you buy a stock, you end up buying an earnings story, not GDP. LatAm earnings are 47% below their pre-financial crisis high, and earnings in USD terms are lower than their financial crisis low. EMEA earnings in USD terms are above their financial crisis low but just barely. Only Asia earnings have continued making new highs. (click to enlarge) Source: Bloomberg Terminal Now, you might argue that a low base lends itself to a powerful rebound, however, as I will further explain, this is not the case. As you can see in Figure 4 , beneficiaries from commodity prices should experience a margin lift from lower input costs while LatAm should suffer from worsening terms of trade. Some countries in EMEA win and some lose, so it’s less clear there. Russia is a loser (NYSEARCA: RSX ). Turkey gains on trade, but loses on the capital account side (NYSEARCA: TUR ). And that leaves South Africa which benefits through the trade balance (NYSEARCA: EZA ). (click to enlarge) In LatAm, commodity income represents 30%, and 60% in EMEA. In Asia, commodities represent only 14% of net income and most of that comes from processors and not extractors. EPS revisions are improving in the case of Asia, but worsening in EMEA and LatAm. Investors should ideally like stocks and markets with improving EPS revisions and shun those with deteriorating conditions. Trailing price-to-earnings ratios for Asia are one standard deviation below average. For EMEA, this number stands at mean, and for LatAm, the P/E is one standard deviation above the mean. Implied EPS growth rate for Asia, EMEA and LatAm are 2.1%, 3.4% and 4.5%, respectively. This means that both EMEA and LatAm need to grow at higher rates in order to justify their valuations. The same story is echoed by the price-to-book. The only measure that would put LatAm on top is the CAPE, however, the CAPE is very dependent on past performance repeating itself in the future, and with low commodity prices, CAPE is a bit out of sync in my opinion. Lower commodity prices, as I mentioned, should hinder energy exporters while benefiting importers as terms of trade are improving for importer countries. Another factor is current account deficits. Mexico (NYSEARCA: EWW ) will most probably follow the Federal Reserve higher, and Brazil’s (NYSEARCA: EWZ ) rates should also increase. Normally, this wouldn’t impact emerging market equities as historically equities have increased after the first Fed rate hike, as a hike usually means growth is returning. However, current account deficits with higher interest rates are not an optimal combination, which should put a limit in stock market price appreciation. If you divide countries with current account surplus vis-a-vis deficit and evaluate how they’ve reacted after the hike, one can evidence a strong divergence between countries with different CA situations ( see Figure 5 ). Asia mostly maintains current account surpluses. This should help maintain Asian equities. (click to enlarge) Investors are still overweight LatAm over Asia based on 60 EM funds ( see Figure 6 ), and this should provide a buying opportunity. A time should arrive when being a contrarian will not be the way to go, however, that time is not here yet. (click to enlarge) I would personally use the SPDR S&P Emerging Asia Pacific ETF to invest in the region. The expense ratio is .49% and 1-year performance ending 01/31/15 was 18.77%. Here is a chart of LTM. A picture says more than a thousand words. GMF data by YCharts Disclosure: The author has no positions in any stocks mentioned, and no plans to initiate any positions within the next 72 hours. (More…) The author wrote this article themselves, and it expresses their own opinions. The author is not receiving compensation for it (other than from Seeking Alpha). The author has no business relationship with any company whose stock is mentioned in this article. Scalper1 News
Scalper1 News