Tag Archives: bstresource

Why I’m Margin SHY

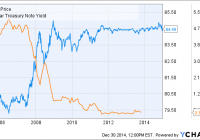
Summary Margin interest rates at major brokers are several percent. One could instead short SHY at the cost of one half a percent. Tail-risk could make this dangerous. ETF Description SHY is the short-duration treasury ETF managed by iShares. It holds treasuries with a duration between 1 and 3 years. It currently yields 0.46%. It effectively mirrors the behavior of the two year yield. SHY data by YCharts Thesis Below is a table taken from Tradeking of current margin rates at major brokers: One could save substantially by instead shorting SHY. For a hypothetical portfolio which has two dollars of equity for each dollar of margin the current interest charge might be 8%. By lowering that to 0.5% by shorting $1 of SHY for each two dollars of equity, our hypothetical portfolio would perform 3.75% better (on equity). Maintaining this level of out-performance would result in having twice as much money over twenty years! One may also benefit from capital gains because short term yields seem, on balance, more likely to rise than fall over the next ten years or so. Investment Risks Is this a free lunch? I’m honestly not quite certain. On May 6th, 2010 the Dow Jones Industrial average dropped 9% and recovered over the course of minutes. Some stocks, like Procter & Gamble, traded down to a penny. If for some reason there was a flash spike in the value of SHY and your broker forced liquidation, you could be wiped out. It’s hard to quantify the likelihood of such a situation. This is in general a problem of using margin, as a flash crash could wipe you out if your broker forced you to sell at pennies. One might be inclined to think that the risk could be decreased by using multiple short-duration treasury ETFs. This is not the case. It simply adds more danger, because any one of them could theoretically trade at an insane level. The fact that each ETF would represent a smaller amount of money doesn’t help, because it only takes one share trading for $100,000 (as some stocks did during the flash crash) to wipe you out. An important question to ask your broker is what they would do in such a situation. Second, if short-term yields declined further the value of SHY could increase. Suppose that short term interest rates went to negative 3% overnight. If the average duration is roughly two years so if the ETF reflects net asset value the value should increase to something like 6% above par. This would translate to a 6% increase in the ETF’s value. This might be scary if it happens overnight but isn’t much larger than you might have paid for interest over the course of the year. Much larger negative interest rates could cause more significant losses. If we saw short term interest rates go to negative 30% the Net Asset Value of the fund would double. If your broker forces you to sell at that point your losses could be substantial. Third, a deflationary environment might cause a similar problem. The value of short term treasuries might spike. To get a substantial loss (eg. 50%) we’d still need to see something like 17% deflation or 17% negative interest rates. Fourth, if your stock portfolio drops in value you might be forced to sell some positions at depressed values to cover your short position. This is more likely than when using margin! Take the time to calculate how much margin or short SHY you should use under different scenarios. You should at least assume that at some point the US stock market will fall 50%. If it does what will happen to your portfolio? If you are using one dollar of margin per dollar of equity then you are wiped out. Similarly, if you are short one dollar of SHY per dollar of equity you are also wiped out. You might be inclined at this point to say, well alright, I’ll just make sure that my margin/SHY is 49% of the value of my stocks. If this happens, your broker is still likely to force a sale at depressed levels, which could leave you with as little as 2% of your original portfolio value. You need to check what the maintenance requirement for margin is with your broker. For example, at Tradeking the maintenance requirement for stocks above $6 is 30% of the current value. After the drawdown you need to end up with at least 30% equity in your account. This means that you could only have started with a ratio of $2 of equity against $1 of margin to avoid a margin call. Any more margin than this is very risky and over long periods will likely wipe you out. If we handle this instead by shorting SHY the calculation is a little different. The amount of equity can’t (in the case of Tradeking) go below 140% of the market value of SHY. This means that we can only use $1 of shorted SHY for every $4 of equity. Even if you don’t intend to own stocks on margin, but instead use the shorted SHY for something else, you still need to pay attention to this rule. (click to enlarge) I don’t own any stocks on margin, but I am shorting a small amount of SHY to take advantage of a 3% interest rate on a checking account. The maximum amount that I feel comfortable using is 20% of the total stock value of the account.

The Security I Like Best: Cash

The five year bull market has pushed stock market valuations again into extreme territory. In John Hussman’s recent commentary ‘Hard-Won Lessons and the Bird in the Hand’, he said: Meanwhile, the S&P 500 is more than double its historical valuation norms on reliable measures (with about 90% correlation with actual subsequent 10-year market returns), sentiment is lopsided, and we observe dispersion across market internals, along with widening credit spreads. These and similar considerations present a coherent pattern that has been informative in market cycles across a century of history – including the period since 2009. None of those considerations inform us that the U.S. stock market currently presents a desirable opportunity to accept risk. we presently estimate prospective S&P 500 10-year nominal total returns of less than 1.4% annually . Investors are being offered the choice between a quite large and easily captured bird in the hand, or two ailing, elusive and possibly imaginary birds in the bush. The S&P 500 isn’t the only asset class with dismal projected future returns. Rob Arnott’s ‘Research Affiliates’ group estimates 10-year expected real returns for the major asset classes. Very few asset classes have expected returns greater than 2%. Arnott estimates U.S. Large Cap stocks at less than 1%: (click to enlarge) From Jeremy Grantham’s 3rd Quarter 2014 Letter to Shareholders ‘Bubble Watch Update’, And make no mistake about it, a world in which cash rates average 0% from here on out is a fairly hellish one. It is our belief that investors get paid for taking unpleasant risks. That compensation is in the form of a risk premium over the “risk-free” rate, and while there are no truly risk-free assets out there, T-Bills are a good enough approximation for many purposes. If that rate is going to be zero real, stocks, bonds, real estate, and everything else investors have in their toolkit should have their expected returns fall as well. In that world there are likely to be no assets priced to deliver as much as 5% real, and the expected return to a 65% stock/35% bond portfolio would drop from 4.7% real to about 3.4% real. I use these projected returns from investors such as Arnott, Jeremy Grantham, Hussman, and myself to generate my own asset allocation. The allocation to a particular asset class depends on its projected return against other assets (chiefly expected future inflation), and the asset volatility. My current allocation consists of: HealthyWealthyWiseProject – Current Asset Allocation (This allocation spreadsheet is kept on the Wealthy page of the website) At 21% of the portfolio, cash is currently my largest single asset class. Cash returns are, as we know, lousy; the little that one can get in liquid instruments inevitably being lower than the toll extracted by inflation. And the long-term returns on cash are terrible, lagging behind every asset class and investment strategy this side of setting money on fire. Still, cash is an option to buy value cheaply in the future. It’s premium price is inflation. Cash is worth holding because it is dry powder which gives the owner options. That optionality varies, of course, based on your view of how richly valued assets are, but it is always there. I note that Jeremy Grantham reported a 17% cash position in the 3rd Quarter. Again from Jeremy Grantham: As always, the prudent investor [..] should definitely recognize overvaluation, factor in regression to the mean, and calculate the longer-term returns that result from this process. More easily, such prudent investors can use our seven-year numbers, which have a decent long-term record measured when we have viewed markets as overpriced, as we believe they are today. A Note on the Presidential Cycle We’ve entered the third year of Obama’s presidency. Presidential Year 3 has been by far the most bullish historically. The average total return in year one has been 8 percent followed by 9.8 percent (Year 2), 21.7 percent (Year 3) and 12 percent (Year 4). Third-year stats have been especially impressive. The return has historically been more than double the average return in either years one and two and the S&P has finished down only once. There’s no guarantee that these aren’t just random patterns, but it’s often thought that third-year gains are a result of stimulus being added to the economy as Election Day approaches. It seems like a good time to prime the pump to put voters in a better mood. Jeremy Grantham respects the Presidential Cycle, and believes the Fed will engineer a fully fledged bubble (S&P 500 over 2250) before a very serious decline. The takeaway is – enjoy this last hurrah while it lasts, with an eye toward increasing your cash position as the year progresses.

How Do You Find Value Investment Ideas?

It’s easy to drown while trying to drink from the fire hose of information that is the stock market. After 25+ years of value investing successes and failures, I’ve come up with my 11 favorite shortcuts to finding promising companies. Did I miss any shortcuts? How do you find value investment ideas? I’ve got the fire roaring, eggnog in hand, enjoying some downtime during the hectic holiday season. The New Year is approaching, which inevitably has me looking back over the investment year that was. There were some successes and, as always, there were some failures. I still flinch while thinking about my ill-timed “deworsification” into the Russian stock market. One question I always try to answer is, “How exactly did I find my best ideas?” Value investing is for investors with a long-term outlook and simply looking back over the last year is not going to be very informative. The sample size is too small and not enough time has elapsed to let investment themes play out. So instead of just looking at the past year, I decided to go back a little further. During my investment career, I have spent a substantial amount of time searching for excellent value ideas. But finding that one gem in the ocean of possible alternatives can be overwhelming. It’s easy to drown while trying to drink from the fire hose of information that is the stock market. So over time, I have unearthed many useful tools that have helped me to discover great ideas. Some of these shortcuts started off extremely useful and continue to be powerful, but some simply didn’t pan out or lost their efficacy. I went back over the last 25+ years of my investing career and tried to recall how I first stumbled across each successful investment idea. I then narrowed this list down to the top 11 ways to find new ideas that I have found most useful. The list progresses from least to most valuable. Traditional Media – I wasn’t sure if I should include media on this list as it can really be more of the delivery mechanism for the other criteria below, but I have been spurred to look closely at a company because of information I’ve gathered through various media outlets, including newspapers, television and business websites. I tend to find investable concepts more than individual stock picks using traditional media, and there is a ton of noise, but there’s a lot of good information out there if you look hard enough. Removal From an Index – Obviously, when a stock is dropped from an index, there is forced selling by index funds that hold the name. However, the index sponsors also try to game the system. Companies that are added to an index tend to be sexy and on an upward trajectory, while companies that are dropped from an index tend to be stodgy and are often out of favor. The oversold cast-offs can be an attractive place to discover value investments. New CEOs – This really depends on the specific situation. If a company’s CEO is retiring after being named Time Magazine’s “Person of the Year”, when the company’s stock price is at an all-time high, it’s not going to attract my attention. If a CEO is pushed out by the board after failing miserably, now we’re talking! A new CEO can make a huge difference in the right situation. Companies that tend to benefit the most from a change at the top tend to have a smaller market cap, a manageable debt load and strong free cash flow. Biggest Percentage Losers – I check the biggest losers list every day. Most of these stocks deserve the sell-off, but every so often a great idea can be salvaged from this discard pile. When bad news comes out, many investors sell first and ask questions later, if ever. I’ve worked as an equity analyst and I have seen this first hand. The thought of going into a client meeting with a dog that dropped 40% makes investment professionals cringe. Stocks that drop dramatically often sail right past true value. 52 Week Lows – This is another list that I check every day. What’s on the list? Why? It’s a fantastic way to spot industry trends as well as to find individual companies that have been left for dead. It’s a fantastic list to use to find bargains, but just because a stock is at a 52-week low, it doesn’t mean it’s undervalued. Exiting Bankruptcy – Companies that are overlooked with a checkered past can often lead to very attractive gains. Bondholders often receive equity when a company emerges from bankruptcy and many times they sell it quickly, depressing the company’s share price. Organizations that are exiting bankruptcy often have smaller debt loads and have shed unattractive businesses during their reorganization, yet are still covered in the taint of failure. If you feel your nose wrinkling as your face contorts into a look of disgust upon hearing the name of a company that imploded into bankruptcy, but is now emerging, you may be on to a great investment idea. Insider Buying – A sizeable open market purchase by an individual with intimate knowledge of a business can be a fantastic buy signal. However, there can be a lot of noise. Ignore small, insignificant purchases and stock acquired through options. Pay more attention to open-market purchases by company management with a good track record of buying and selling stock, especially when there is size to their trades. Gurus – Do you have a team of 20 well-paid, remarkably intelligent and highly-trained analysts at your disposal? No? Neither do I, but many successful value managers have this and much more. So why not utilize their resources? I don’t tend to get too excited when I see that 40 hedge fund managers own Apple, but when a highly-respected value manager purchases 5% of a $100 million company, then I tend to take notice. Always pay attention to the type of manager you follow as some trade frequently and utilizing their public filings is not advisable. However, there is an extended list of value managers with long-term time horizons and superior track records that trade infrequently. Untraditional Media – I would include blogs and newsletters in this category, including Seeking Alpha. Ideas from untraditional media can be hit or miss, but I’ve cultivated a small group of analysts/investors that I genuinely trust and rely on. Unlike many of the other resources I use to find investment ideas, I can assume that the ideas presented by this trusted group will be well-thought-out and worth a second look. I’m always searching for smart investors that share the same value investing methodology as myself. Sentiment – As a value investor, I want to see high negative sentiment. The more hated and despised a company is, then the more interested I become. When everyone is negative, the slightest positive news can start to move a stock upward. I have always viewed traditional academic value screens as a measure of sentiment. The reason most companies are trading in the bottom decile of book value is that they are hated. Some of my favorite valuation screens include price/book, price/sales and EV/EBITDA. If these metrics are depressed, you likely have a company with very poor sentiment. Spin-offs – I know. I’m sure many of you are cringing, wondering why you should sit through another narrative on why spin-offs are so great. I agree…but they still work. I won’t go through all of the reasons that spin-offs tend to outperform as the information is freely available across the internet. If the information is so freely available, shouldn’t the strategy stop working? Yes, it should. But when going back through my investing career, I have used the strategy to consistently find huge winners. I imagine that spin-offs will lose their ability to outperform eventually, but I don’t believe we are at that point just yet. Index funds still dump spin-offs that are not in their index and individuals still dump the 25 share position that has magically appeared on their brokerage statement. Although investors need to be more selective when investing in spin-offs today, especially when many savvy investors are familiar with the strategy, there are still excellent opportunities available. Hopefully I’ve been able to outline a strategy or two that readers will find helpful. Undoubtedly, there are many more strategies that successful investors use to uncover great value ideas that I have missed. I’d love to hear from the Seeking Alpha community. How do you find value investment ideas?