Scalper1 News
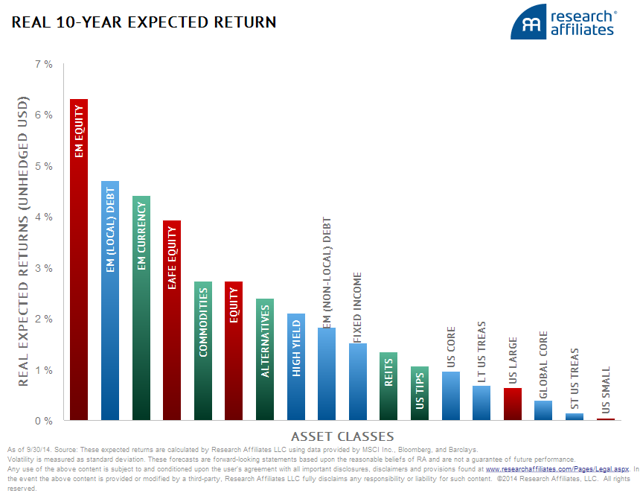
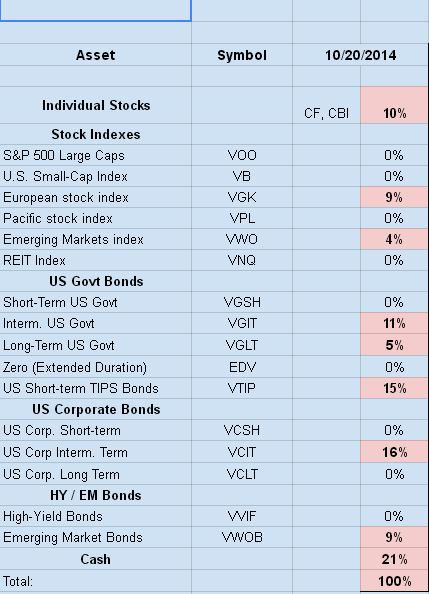 The five year bull market has pushed stock market valuations again into extreme territory. In John Hussman’s recent commentary ‘Hard-Won Lessons and the Bird in the Hand’, he said: Meanwhile, the S&P 500 is more than double its historical valuation norms on reliable measures (with about 90% correlation with actual subsequent 10-year market returns), sentiment is lopsided, and we observe dispersion across market internals, along with widening credit spreads. These and similar considerations present a coherent pattern that has been informative in market cycles across a century of history – including the period since 2009. None of those considerations inform us that the U.S. stock market currently presents a desirable opportunity to accept risk. we presently estimate prospective S&P 500 10-year nominal total returns of less than 1.4% annually . Investors are being offered the choice between a quite large and easily captured bird in the hand, or two ailing, elusive and possibly imaginary birds in the bush. The S&P 500 isn’t the only asset class with dismal projected future returns. Rob Arnott’s ‘Research Affiliates’ group estimates 10-year expected real returns for the major asset classes. Very few asset classes have expected returns greater than 2%. Arnott estimates U.S. Large Cap stocks at less than 1%: (click to enlarge) From Jeremy Grantham’s 3rd Quarter 2014 Letter to Shareholders ‘Bubble Watch Update’, And make no mistake about it, a world in which cash rates average 0% from here on out is a fairly hellish one. It is our belief that investors get paid for taking unpleasant risks. That compensation is in the form of a risk premium over the “risk-free” rate, and while there are no truly risk-free assets out there, T-Bills are a good enough approximation for many purposes. If that rate is going to be zero real, stocks, bonds, real estate, and everything else investors have in their toolkit should have their expected returns fall as well. In that world there are likely to be no assets priced to deliver as much as 5% real, and the expected return to a 65% stock/35% bond portfolio would drop from 4.7% real to about 3.4% real. I use these projected returns from investors such as Arnott, Jeremy Grantham, Hussman, and myself to generate my own asset allocation. The allocation to a particular asset class depends on its projected return against other assets (chiefly expected future inflation), and the asset volatility. My current allocation consists of: HealthyWealthyWiseProject – Current Asset Allocation (This allocation spreadsheet is kept on the Wealthy page of the website) At 21% of the portfolio, cash is currently my largest single asset class. Cash returns are, as we know, lousy; the little that one can get in liquid instruments inevitably being lower than the toll extracted by inflation. And the long-term returns on cash are terrible, lagging behind every asset class and investment strategy this side of setting money on fire. Still, cash is an option to buy value cheaply in the future. It’s premium price is inflation. Cash is worth holding because it is dry powder which gives the owner options. That optionality varies, of course, based on your view of how richly valued assets are, but it is always there. I note that Jeremy Grantham reported a 17% cash position in the 3rd Quarter. Again from Jeremy Grantham: As always, the prudent investor [..] should definitely recognize overvaluation, factor in regression to the mean, and calculate the longer-term returns that result from this process. More easily, such prudent investors can use our seven-year numbers, which have a decent long-term record measured when we have viewed markets as overpriced, as we believe they are today. A Note on the Presidential Cycle We’ve entered the third year of Obama’s presidency. Presidential Year 3 has been by far the most bullish historically. The average total return in year one has been 8 percent followed by 9.8 percent (Year 2), 21.7 percent (Year 3) and 12 percent (Year 4). Third-year stats have been especially impressive. The return has historically been more than double the average return in either years one and two and the S&P has finished down only once. There’s no guarantee that these aren’t just random patterns, but it’s often thought that third-year gains are a result of stimulus being added to the economy as Election Day approaches. It seems like a good time to prime the pump to put voters in a better mood. Jeremy Grantham respects the Presidential Cycle, and believes the Fed will engineer a fully fledged bubble (S&P 500 over 2250) before a very serious decline. The takeaway is – enjoy this last hurrah while it lasts, with an eye toward increasing your cash position as the year progresses. Scalper1 News
Scalper1 News