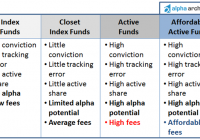
Editor’s note: Originally published on December 1, 2014 by Charles Boccadoro The ValueShares US Quantitative Value (BATS: QVAL ) strategy seeks long-term capital appreciation by investing in a concentrated portfolio of 40 or so US exchange traded stocks of larger capitalizations, which the adviser determines to be undervalued but possess strong economic moats and financial strength. In a nutshell: QVAL buys “the cheapest, highest quality value stocks.” The fund attempts to actively capture returns in excess of the so-called ” value anomaly ” or premium, first identified in 1992 by Professors Fama and French. Basically, stocks with lower valuation (and smaller size) deliver greater than excess returns than the overall market. Using valuation and quality metrics based on empirically vetted academic research, the adviser believes QVAL will deliver positive alpha – higher returns than can be explained by the high-book-to-market value factor. The adviser implements the QVAL strategy in strictly systematic and quant fashion, because it believes that stock picking based on fundamentals, where value managers try to exploit qualitative signals (e.g., Ben Graham’s cigar butts), is fraught with behavioral biases that “lead to predictable underperformance.” Adviser Alpha Architect, LLC maintains the QVAL ETF Trust. Empowered Funds, LLC, which does business as Alpha Architect, is the statutory adviser. Alpha Architect is an SEC-registered investment advisor and asset management firm based in Broomall, Pennsylvania. It offers separately managed accounts (SMAs) for high net worth individuals, family offices, and exchange-traded funds (ETFs). It does not manage hedge funds. There are eight full-time employees, all owner/operators. A ninth employee begins 1 January. Why Broomall, Pennsylvania? The adviser explains it “is the best value in the area-lowest tax, best prices, good access… the entire team lives 5-10 minutes away and we all hate commuting and have a disdain for flash.” It helps too that it’s close to Drexel University Lebow School of Business and University of Pennsylvania Wharton School of Business, since just about everyone on the team has ties to one or both of these schools. But the real reason, according to two of the managing members: “We both have roots in Colorado, but our wives are both from Philadelphia. We each decided to ‘compromise’ with our wives and settled on Philadelphia.” Currently, the firm manages about $200M. Based on client needs, the firm employs various strategies, including “quantitative value,” which is the basis for QVAL, and robust asset allocation, which employs uncorrelated (or at least less correlated) asset allocation and trend following like that described in The Ivy Portfolio . QVAL is the firm’s first ETF. It is a pure-play, long-only, valued-based strategy. Three other ETFs are pending. IVAL , an international complement to QVAL, is expected to launch in the next few weeks. QMOM will be a pure-play, long-only, momentum-based strategy, launching middle of next year. Finally, IMOM, international complement to QMOM. ValueShares is the brand name of Alpha Architect’s two value-based ETFs. MomentumShares will be the brand name for its two momentum-based ETFs. The adviser thoroughly appreciates the benefits and pitfalls of each strategy, but mutual appreciation is not shared by each investor camp, hence the separate brand names. With their active ETF offerings, Alpha Architect is challenging the investment industry as detailed in the recent post ” The Alpha Architect Proposition .” The adviser believes that: The investment industry today thrives “on complexity and opaqueness to promote high-priced, low-value add products to confuse investors who are overwhelmed by financial decisions.” “…active managers often overcharge for the expected alpha they deliver. Net of fees/costs/taxes, investors are usually better served via low-cost passive allocations.” “Is it essentially impossible to generate genuine alpha in closet-indexing, low-tracking error strategies that will never get an institutional manager fired.” Its goal is “to disrupt this calculus…to deliver Affordable Active Alpha for those investors who believe that markets aren’t perfectly efficient.” The table below depicts how the adviser sees current asset management landscape and the opportunity for its new ETFs. Notice that Active Share, Antti Petajisto’s measure of active portfolio management (ref. ” How Active Is Your Fund Manager? A New Measure That Predicts Performance “) is a key tenant. David Snowball started including this metric in MFO fund profiles last March. Managers Wesley Gray is the executive managing member of Alpha Architect and lead portfolio manager for QVAL. We first wrote about him in the September commentary (see Morningstar ETF Conference Notes and Beware of Geeks Bewaring Formulas ). To say we were late to his story would be a colossal understatement. NPR’s Neil Simon interviewed him for Weekend Edition in 2009 when Wesley was in his final year at University of Chicago Booth School of Business completing his PhD and MBA. The interview wasn’t about quant research or behavioral economics, but Wesley’s time in Iraq where is served as a Marine lieutenant on the Military Transition Team, embedded as an adviser inside the Iraqi Army. The National Review describes Wesley’s 2003 book Embedded as “…brutally honest…no attempts at equivocation…raw yet thoughtful…intelligent…a perspective we have lacked for too long.” Aside from Wesley’s four years in the military, which fulfilled his long-held desire to engage in public service, he’s been pursuing an investing career since childhood. At age 12, he earned $3K at the 4-H fair from selling a steer he raised. His grandmother, “an obsessed Buffett fan,” sent him a copy of The Intelligent Investor . He started trading stocks seriously the minute he opened a brokerage account at age 18 while an undergrad at Wharton, even starting a little LP called ValueBull Investment Partnership with $250K raised from friends and family. In 2010, he formed the investment adviser Empiritrage, LLC, which was short for ” Empiri cal-Based Arbi trage. ” He was an assistant professor of finance at Drexel and had just after completed his doctoral thesis on information exchange and the limits of arbitrage (ref. ” Facebook for Finance: Why do Investors Share Ideas via Their Social Networks? “). During that time, he also formed Turnkey Analyst, LLC, a firm dedicated to the educating investors and sharing quantitative techniques to the general public. In early 2013, Wiley published the book Quantitative Value, A Practitioner’s Guide to Automating Intelligent Investment and Eliminating Behavioral Errors , which Wesley co-authored with Tobias Carlisle. It’s quickly become a must-read for value investors and quants alike. (I burned through its 274 pages in two sittings.) The book’s success increased interest in the firm, which is part of the firm’s business development strategy. “Through our educational efforts, we hope that investors learn about us and eventually reach out for our services. So far, the strategy is working wonderfully.” The only problem was nobody could pronounce Empiritrage and “nobody got it.” So, the firm pulled together Empiritrage, Turnkey, and other entities under one roof to form Alpha Architect, its trademark. It required swallowing a massive pain pill (redirecting blogs, Twitter feeds, etc.), but “we are all happier now that we have one name to operate.” Wesley gave up his professorship at Drexel. He and his team are now entirely focused on making their clients and their (now one) firm successful. The other portfolio managers responsible for the day-to-day QVAL management of the are Patrick Cleary, David Foulke, Carl Kanner, Jack Vogel, Tao Wang and Yang Xu. “Portfolio management at a quant team is … truly a team effort.” Jack, Yang, and Tao work the research, trading, and execution side. All former students of and all handpicked by Wesley. Jack holds a PhD in Finance and an MS in Mathematics. Yang and Tao hold MS degrees in Finance. Patrick, David, and Carl work the operations side. Patrick, like Wesley, a former Marine Corps Captain, with an MBA from Harvard is the firm’s COO. While David, the firm’s compliance officer, holds an MBA from Wharton. Carl holds a BS in Business from Babson. They are all assisted behind the scenes by Tian “Get ‘er done” Yao, several consultants (mostly from academia), and a compliance lawyer. Strategy Capacity and Closure As structured currently, QVAL has the capacity for about $1B. The adviser has done a lot of research that shows, from a quant perspective, larger scale would come with attendant drop in expected annualized return “~100-150bps, but gives us capacity to $5-10B.” Active Share 74.5. “Active share” measures the degree to which a fund’s portfolio differs from the holdings of its benchmark portfolio, which for QVAL is S&P500 Total Return index. In response to our inquiry, the adviser provided an Active Share spread-sheet for several value funds. It shows, for example, Dodge & Cox Fund has an Active Share of 68.7. MFO has tried to collect and maintain this metric for various funds on our Active Share webpage . Antti Petajisto’s website only provides data through 2009. Morningstar holds the current values close. Only a few fund houses (e.g., FPA) publish them on their fact sheets. So, we were excited to learn that Alpha Architect is building a tool to compute Active Share for all funds using the most current 13F filings. The tool will be part of its 100% free (but registration required) DIY Investing webpage. Management’s Stake in the Fund As of October 20, 2014, the SAI filing did not indicate any stake by the portfolio managers or trustees in the new fund. But the adviser’s executive managing member Wesley Gray indicates that he and two other partners have 100% of their personal savings in QVAL, while a fourth is 100% across the firm’s strategies. A fifth member has a 100% of discretionary savings in QVAL with non-discretionary tied-up in a long established trust. The full team investment in QVAL amounts to $1.2M with an additional $5M from member families. The SAI did show that its three Independent Trustees are each paid an annual retainer of $4K for attendance at meetings of the Board. Wesley reports that two of trustees have $10K+ invested. Opening Date October 22, 2014. In its very short history through November 28, 2014, it has quickly amassed $18.4M in AUM. Minimum Investment QVAL is an ETF, which means it trades like a stock. At market close on November 28, 2014, the share price was $26.13. Expense Ratio 0.79%. There is no 12b-1 fee. As of October 2014, a review of US long-only, open-ended mutual funds (OEFs) and ETFs across the nine Morningstar domestic categories (small value to large growth) shows just over 2500 unique offerings, including 269 ETFs, but only 19 ETFs not following an index. Average er of these ETFs not following an index is 0.81%. Average er for index-following ETFs is 0.39%. Average er of the OEFs is 1.13%, with sadly about one third of these charging front-loads of nominally 5.5%. (This continuing practice never ceases to disappoint me.) Average er of OEFs across all share classes in this group is 1.25%. QVAL appears to be just under the average of its “active” ETF peers, in between a couple other notables: Cambria Shareholder Yield ETF (NYSEARCA: SYLD ) at 0.59% and AdvisorShares TrimTabs Float Shrink ETF (NYSEARCA: TTFS ) at 0.99%. But there is more… The adviser informs us that there are “NO SOFT DOLLARS” in the QVAL fee structure. What’s that mean? The SEC defines soft dollars in its 1998 document ” Inspection Report on the Soft Dollar Practices of Broker-Dealers, Investment Advisers and Mutual Funds .” Advisers that use soft dollars agree to pay higher commissions to broker-dealers to execute its trades in exchange for things like Bloomberg terminals and research databases, things that the adviser could choose to pay out of its own pocket, but rarely does. The higher commissions translate to higher transactions fees that are passed onto investors, effectively increasing er through a “hidden” fee. “Hidden” outside the er, but disclosed in the fine print. To assess whether your fund’s adviser imposes a “soft dollar” fee, look in its SAI under the section typically entitled “Brokerage Selection” or “Portfolio Transactions and Brokerage.” Here’s how the disclosure reads, something like: To the extent Adviser obtains brokerage and research services from a broker-dealer that it otherwise would acquire at its own expense, Adviser may have an incentive pay higher commissions than would otherwise be the case. Here’s how the QVAL SAI reads: Adviser does not currently use soft dollars. Comments Among the many great ideas and anecdotes conveyed in the book Quantitative Value, one is about the crash of the B-17 Flying Fortress during a test flight at Wright Air Field in Dayton, Ohio. The year was 1935. The incident took the life of Army Air Corps’ chief test pilot Major Ployer Hill, a very experienced pilot. Initially, people blamed the plane. That must have failed mechanically, or it was simply too difficult to fly. But the investigation concluded “pilot error” caused the accident. “It turned out the Flying Fortress was not ‘too much airplane for one man to fly,’ it was simply too much airplane for one man to fly from memory .” In response to the incident, the Army Air Corps successfully instituted checklists, which remain intrinsic to all pilot and test pilot procedures today. The authors of Quantitative Value and the adviser of QVAL believe that the strategy becomes the checklist. The following diagram depicts the five principal steps in the strategy “checklist” the adviser employs to systematically invest in “the cheapest, highest quality value stocks.” A more detailed description of each step is offered in the post ” Our Quantitative Value Philosophy ,” which is a much abbreviated version of the book. The book culminates with results showing the qualitative value strategy beating S&P500 handily between 1974 through 2011, delivering much higher annualized returns with lower drawdown and volatility. Over the same period, it also bested Joel Greenblatt’s similar Magic Formula strategy made popular in The Little Book That Beats The Market . Finally, between 1991 and 2011, it outperformed three of the top activity managed funds of the period – Sequoia, Legg Mason Value, and Third Avenue Value. Sequoia, one of the greatest funds ever, is the only one that closely competed based on basic risk/reward metrics. The quantitative value strategy has evolved over the past 12 years. Wesley states that, “barring some miraculous change in human psychology or a ‘eureka’ moment on the R&D side,” it is pretty much set for the foreseeable future. Before including QVAL in your portfolio, which is based on the strategy outlined in the book, a couple precautions to consider… First, it is long only, always fully invested, and does not impose an absolute value constraint. It takes the “cheapest 10%,” so there will always be stocks in its portfolio even if the overall market is rocketing higher, perhaps irrationally higher. It applies no draw down control. It never moves to cash. While it may use Ben Graham’s distillation of sound investing, known as “margin of safety,” to good effect, if the overall market tanks, QVAL will likely tank too. An investor should therefore allocate to QVAL based on investment timeline and risk tolerance. More conservative investors could also use the strategy to create a more market neutral portfolio by going long QVAL and dynamically shorting S&P 500 futures – a DIY hedge fund for a lot less than 2/20 and a lot more tax-efficient. “In this structure you get to spread bet between deep value and the market, which has been a good bet historically,” Wesley explains. Second, it has no sector diversification constraint. So, if an entire sector heads south, like energy has done lately, the QVAL portfolio will likely be heavy the beaten-down sector. Wesley defends this aspect of the strategy: “Sector diversification simply prevents good ideas (i.e., true value investing) from working. We’ve examined this and this is also what everyone else does. And just because everyone else is doing it, doesn’t mean it is a good idea.” Bottom Line The just launched ValueShares US Quantitative Value ETF appears to be an efficient, transparent, well formulated, and systematic vehicle to capture the value premium historically delivered by the U.S. market… and maybe more. Its start-up adviser, Alpha Architect, is a well-capitalized firm with minimalist needs, a research-oriented academic culture, and passionate leadership. It is actually encouraging its many SMA customers to move to ETFs, which have inherently lower cost and no minimums. If the concept of value investing appeals to you (and it should), if you believe that markets are not always efficient and offer opportunities for active strategies to exploit them, and if you are tired of scratching your head trying to understand ad hoc actions of your current portfolio manager while paying high expenses (you really should be), then QVAL should be on your very short list. Fund Website The team at Alpha Architect pumps a ton of educational content on its website , which includes white papers, DIY investing tools, and its blog. Disclosure : No positions