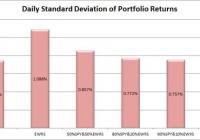
Summary I’m taking a look at EWRS as a candidate for inclusion in my ETF portfolio. The low correlation is very attractive, but isn’t reliable because of poor liquidity. I’ll have to do further investigation to see if it is real. I’ll keep it on my list for potential exposure to small caps. The internal diversification of holdings within the ETF is excellent and an equal weighting scheme sounds very attractive relative to market cap strategies. I’m not assessing any tax impacts. Investors should check their own situation for tax exposure. How to read this article : If you’re new to my ETF articles, just keep reading. If you have read this intro to my ETF articles before, skip down to the line of asterisks. This section introduces my methodology. By describing my method initially, investors can rapidly process each ETF analysis to gather the most relevant information in a matter of minutes. My goal is to provide investors with immediate access to the data that I feel is most useful in making an investment decision. Some of the information I provide is readily available elsewhere, and some requires running significant analysis that, to my knowledge, is not available for free anywhere else on the internet. My conclusions are also not available anywhere else. What I believe investors should know My analysis relies heavily on Modern Portfolio Theory. Therefore, I will be focused on the statistical implications of including a fund in a portfolio. Since the potential combinations within a portfolio are practically infinite, I begin by eliminating ETFs that appear to be weak relative to the other options. It would be ideal to be able to run simulations across literally billions of combinations, but it is completely impractical. To find ETFs that are worth further consideration I start with statistical analysis. Rather than put readers to sleep, I’ll present the data in charts that only take seconds to process. I include an ANOVA table for readers that want the deeper statistical analysis, but readers that are not able to read the ANOVA table will still be able to understand my entire analysis. I believe there are two methods for investing. Either you should know more than the other people performing analysis so you can make better decisions, or use extensive diversification and math to outperform most investors. Under CAPM (Capital Asset Pricing Model), it is assumed every investor would hold the same optimal portfolio and combine it with the risk free asset to reach their preferred spot on the risk and return curve. Do you know anyone that is holding the exact same portfolio you are? I don’t know of anyone else with exactly my exposure, though I do believe there are some investors that are holding nothing but SPY. In general, I believe most investors hold a portfolio that has dramatically more risk than required to reach their expected (under economics, disregarding their personal expectations) level of returns. In my opinion, every rational investor should be seeking the optimal combination of risk and reward. For any given level of expected reward, there is no economically justifiable reason to take on more risk than is required. However, risk and return can be difficult to explain. Defining “Risk” I believe the best ways to define risk come from statistics. I want to know the standard deviation of the returns on a portfolio. Those returns could be measured daily, weekly, monthly, or annually. Due to limited sample sizes because some of the ETFs are relatively new, I usually begin by using the daily standard deviation. If the ETF performs well enough to stay on my list, the next levels of analysis will become more complex. Ultimately, we probably shouldn’t be concerned about volatility in our portfolio value if the value always bounced back the following day. However, I believe that the vast majority of the time the movement today tells us nothing about the movement tomorrow. While returns don’t dictate future returns, volatility over the previous couple years is a good indicator of volatility in the future unless there is a fundamental change in the market. Defining “Returns” I see return as the increase over time in the value known as “dividend adjusted close”. This value is provided by Yahoo. I won’t focus much on historical returns because I think they are largely useless. I care about the volatility of the returns, but not the actual returns. Predicting returns for a future period by looking at the previous period is akin to placing a poker bet based on the cards you held in the previous round. Defining “Risk Adjusted Returns” Based on my definitions of risk and return, my goal is to maximize returns relative to the amount of risk I experienced. It is easiest to explain with an example: Assume the risk free rate is 2%. Assume SPY is the default portfolio. Then the risk level on SPY is equal to one “unit” of risk. If SPY returns 6%, then the return was 4% for one unit of risk. If a portfolio has 50% of the risk level on SPY and returns 4%, then the portfolios generated 2% in returns for half of one unit of risk. Those two portfolios would be equal in providing risk adjusted returns. Most investors are fueled by greed and focused very heavily on generating returns without sufficient respect for the level of risk. I don’t want to compete directly in that game, so I focus on reducing the risk. If I can eliminate a substantial portion of the risk, then my returns on a risk adjusted basis should be substantially better. Belief about yields I believe a portfolio with a stronger yield is superior to one with a weaker yield if the expected total return and risk is the same. I like strong yields on portfolios because it protects investors from human error. One of the greatest risks to an otherwise intelligent investor is being caught up in the mood of the market and selling low or buying high. When an investor has to manually manage their portfolio, they are putting themselves in the dangerous situation of responding to sensationalistic stories. I believe this is especially true for retiring investors that need money to live on. By having a strong yield on the portfolio it is possible for investors to live off the income as needed without selling any security. This makes it much easier to stick to an intelligently designed plan rather than allowing emotions to dictate poor choices. In the recent crash, investors that sold at the bottom suffered dramatic losses and missed out on substantial gains. Investors that were simply taking the yield on their portfolio were just fine. Investors with automatic rebalancing and an intelligent asset allocation plan were in place to make some attractive gains. Personal situation I have a few retirement accounts already, but I decided to open a new solo 401K so I could put more of my earnings into tax advantaged accounts. After some research, I selected Charles Schwab as my brokerage on the recommendation of another analyst. Under the Schwab plan “ETF OneSource” I am able to trade qualifying ETFs with no commissions. I want to rebalance my portfolio frequently, so I have a strong preference for ETFs that qualify for this plan. Schwab is not providing me with any compensation in any manner for my articles. I have absolutely no other relationship with the brokerage firm. Because this is a new retirement account, I will probably begin with a balance between $9,000 and $11,000. I intend to invest very heavily in ETFs. My other accounts are with different brokerages and invested in different funds. Views on expense ratios Some analysts are heavily opposed to focusing on expense ratios. I don’t think investors should make decisions simply on the expense ratio, but the economic research I have covered supports the premise that overall higher expense ratios within a given category do not result in higher returns and may correlate to lower returns. The required level of statistical proof is fairly significant to determine if the higher ratios are actually causing lower returns. I believe the underlying assets, and thus Net Asset Value, should drive the price of the ETF. However, attempting to predict the price movements of every stock within an ETF would be a very difficult and time consuming job. By the time we want to compare several ETFs, one full time analyst would be unable to adequately cover every company. On the other hand, the expense ratio is the only thing I believe investors can truly be certain of prior to buying the ETF. Taxes I am not a CPA or CFP. I will not be assessing tax impacts. Investors needing help with tax considerations should consult a qualified professional that can assist them with their individual situation. The rest of this article By disclosing my views and process at the top of the article, I will be able to rapidly present data, analysis, and my opinion without having to explain the rationale behind how I reached each decision. The rest of the report begins below: ******** (NYSEARCA: EWRS ): Guggenheim Russell 2000 Equal Weight ETF Tracking Index: Guggenheim Russell 2000 Equal Weight Index Allocation of Assets: At least 80% in assets included in the index Morningstar Category: Small Blend Time period starts: April 2012 Time period ends: December 2014 Portfolio Std. Deviation Chart: (click to enlarge) (click to enlarge) Correlation: 73.45% Returns over the sample period: (click to enlarge) Liquidity (Average shares/day over last 10): 4,379 Days with no change in dividend adjusted close: 42 Days with no change in dividend adjusted close for SPY: Yield: 1.01% Distribution Yield Expense Ratio: .45% Discount or Premium to NAV: .10% premium Holdings: (click to enlarge) Further Consideration: I’ll keep EWRS in my potential list for now Conclusion: There are quite a few things I like about EWRS, but also a few problems will merit deeper analysis. The good things are the low correlation and the equal weighting of the index was very impressive diversification within the ETF. The largest hold at reached a market weight of .30%. That is incredible diversification within the ETF. Even if the ETF is aiming for an exact equal weighting, they can’t reasonably be rebalancing constantly so there should be some deviations. The bad news is that the liquidity is absolutely terrible and the terrible liquidity may have been a driving factor in the 42 days with no change in dividend adjusted closes. This is one of the ETFs where poor liquidity could be reducing the reliability of the statistics. If the correlation is significantly higher than it appears but is being understated because of poor liquidity, it would make the ETF significantly less attractive. The combination of poor liquidity and low yield makes the ETF substantially less attractive for investors that are seeking income or needing liquidity. While I’m willing to cope with those problems if the correlation turns out to be accurate, I still don’t like the expense ratio much. Given that the portfolio is to be equally weighted and has very small exposure to each individual stock, I would be willing to accept the expenses if I was using the portfolio as a small part of my portfolio. This may be a decent option for getting some small cap exposure into my portfolio. If I pick EWRS, I’d only plan on using it for 5% to 10% of the portfolio. If poor liquidity is a major issue when the markets are open, I would consider keeping an eye on NAV and using a (one day) limit order to try to buy up a piece for a 1 to 2% discount to NAV. I would consider the ETF fairly attractive if it could be purchased at that kind of discount to NAV.