Tag Archives: author

Realized Risk And Returns In Developed Markets

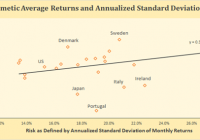
By Baijnath Ramraika, CFA In a paper I co-authored with Prashant Trivedi, we constructed all stock market-cap weighted indices for each one of the twenty-three developed markets included in the MSCI Developed Markets Index as of December 31st, 2014. In the paper, we showed each country’s all-stock index in U.S. dollars as well as local currency terms and also reported the number of companies that were included in the country’s index every year. Every country’s annual local currency returns and the annualized standard deviation of these returns were plotted on a scatter graph. A line of best fit was drawn to check if investors were compensated for the risk they took, i.e., did higher risk as defined by standard deviation of returns correspond with higher returns. Figure 1 below shows this relationship with returns on y-axis and risk on x-axis. Note that returns for the purposes of this chart have been defined as arithmetic average of annual returns. As is seen, the line is upward sloping, i.e., higher the risk, higher the return. Figure 1 (click to enlarge) Developed Markets – Risk vs. Arithmetic Returns So does that mean that markets were efficient in the sense that high returns are accompanied with high risk. Not so fast. Remember, I pointed out earlier that Figure 1 was based on arithmetic average of annual returns. This is where you have to pay attention. An important quirk here relates to the fact that equity markets tend to produce negative returns every once a while. Consider a simple hypothetical problem with two year investment returns being +50% in Year 1 and -50% in Year 2. If you invested $100 at the beginning of Year 1, you will end Year 1 with $150 (+50% return). The 50% loss in the second year means that you will end Year 2 with $75, i.e., at the end of the Year 2, your cumulative loss is -25%. However, the arithmetic average of the two annual numbers is 0% [(+50%-50%)/2]. The lesson here is that if there are negative returns in any of the measurement periods, arithmetic average overstates investment performance. Figure 2 below shows the relationship between realized risk and returns in developed markets, similar to Figure 1. However, instead of using arithmetic average, Figure 2 uses geometric average of annual returns. Interestingly, the upward slope has given way to a slight downward slope with the distribution around the line of best fit widening substantially. (click to enlarge) Developed Markets – Risk vs. Geometric Returns While the correlation between risk and arithmetic average return as plotted in Figure 1 was positive at +34%, the correlation between risk and geometric average return as plotted in Figure 2 is negative at -6%. In fact, the correlation is so low as to suggest that realized returns had no relationship with realized risk. That’s another way of saying that higher risk did not translate in higher returns.

Momentum Vs. Cap-Weighted Sectors: Know What You Own

In February of 2014, we were hired to be the index provider for 9 PowerShares sector ETFs and they then became the PowerShares DWA Momentum Sector ETFs. This was an extension of the work that we were already doing with PowerShares in creating the indexes used for PDP , PIE , PIZ , and DWAS . The idea behind these Momentum sectors was to identify the top momentum names from each sector and then weight the stocks in the index by momentum. This is a clear departure from creating a sector index that is just weighted by market capitalization. To get an idea of just how different a momentum-weighted and a capitalization-weighted sector ETF can be, consider the table below. It shows the top 5 holdings and weights of those holdings in each of our momentum sectors and compares that exposure to a capitalization-weighted ETF. (click to enlarge) Source: PowerShares and State Street, As of 2/4/15 As you can see, there can be significant differences in exposure. Two key reasons for the differences: We weight the stocks by momentum and not by capitalization. Our investment universe also consists of Small, Mid, and Large Cap stocks. Weighting sector ETFs by momentum, we believe, will lead to superior results over time. The relative strength strategy is NOT a guarantee. There may be times where all investments and strategies are unfavorable and depreciate in value. See www.powershares.com for more information. Dorsey Wright is the index provider for a suite of momentum ETFs with PowerShares. Are you Bullish or Bearish on ? Bullish Bearish Neutral Results for ( ) Thanks for sharing your thoughts. Submit & View Results Skip to results » Share this article with a colleague

Apple And IBM Enter The PowerShares Buyback ETF

Apple and IBM are now holdings of PKW. 5% of shares outstanding was the key cutoff line. These two tech heavyweights represent more than 10% of the ETF. Additions should make this growing ETF more popular. When investors look at exchange-traded funds, there are a number of choices out there. You can buy an index ETF like the SPDR S&P 500 (NYSEARCA: SPY ), a sector ETF like the Energy Select Sector SPDR (NYSEARCA: XLE ), or even a country fund like the iShares MSCI Germany (NYSEARCA: EWG ). There are certainly ETFs for everyone, and there are even many specialty ones. One of my favorite ETFs is the PowerShares Buyback Achievers Portfolio ETF (NYSEARCA: PKW ), an exchange-traded fund that buys stock in companies that are buying back stock, and lots of it. I’ve written about this ETF a couple of times, and today I’m here to write about it again. My first article on PKW was in regards to a major shakeup that could come involving technology giant Apple (NASDAQ: AAPL ). As many investors know, Apple has an extremely large share repurchase plan in place. Well, PKW has just done its annual reconstitution, and Apple and tech giant IBM (NYSE: IBM ) are now holdings in this ETF. Today, I’ll look at what that means for both stocks, as well as PKW. For those that have not heard of this ETF, please see the above-linked article for the complete description. The main idea is to include companies that have bought back at least 5% of their outstanding shares over the past twelve months. The fund is reconstituted every January and rebalanced four times a year. Apple recently announced a tremendous quarter highlighted by nearly 75 million iPhone sales. The strength of the phone and other products has allowed Apple to spend more than $70 billion on its buyback in the past couple of years. Last year, Apple missed out on inclusion in this ETF, but in the past twelve months, the share count has come down by more than 6%. IBM has also been buying back a tremendous amount of shares, and it is the third-largest holding in the fund. In the table below, you can see the other top ten holdings, which include Home Depot (NYSE: HD ), Boeing (NYSE: BA ), Twenty-First Century Fox (NASDAQ: FOXA ), Lowe’s (NYSE: LOW ), Time Warner (NYSE: TWX ), Express Scripts (NASDAQ: ESRX ), Monsanto (NYSE: MON ), and FedEx (NYSE: FDX ). That’s an impressive list of companies, including a couple of Dow components. (See all holdings here ) The total value of the ETF is a little over $2.7 billion, meaning Apple represents about $145 million. That doesn’t sound like much when thinking about Carl Icahn’s couple of billion worth of Apple’s shares or the market cap of nearly $700 billion. However, to the average investor, it is still a lot of money. Another ETF buying up a chunk of Apple makes less shares available to the public, which Apple’s buyback is also helping with. Adding Apple and IBM to the ETF should help PKW become more popular. On the face of it, a buyback ETF seems like a great idea. When stocks are rising, those that are buying back shares should do even better. When stocks are falling, buybacks should ease the fall. Companies are spending a ton of money on buybacks currently . In the chart below, you can see how PKW has significantly outperformed SPY over the past five years. (click to enlarge) (Source: Yahoo! Finance) The ETF market just got a bit more interesting, as Apple and IBM have been added to the PowerShares Buyback Achievers Portfolio ETF. These names may only stay in the ETF for a year, but they certainly will attract attention to PKW. This has been one of my favorite ETFs over the past couple of years, and its performance has been rather spectacular. For those looking for some exposure to Apple or IBM without gambling on them individually or the tech sector as a whole, perhaps you should take a look at this name. Disclosure: The author has no positions in any stocks mentioned, and no plans to initiate any positions within the next 72 hours. (More…) The author wrote this article themselves, and it expresses their own opinions. The author is not receiving compensation for it (other than from Seeking Alpha). The author has no business relationship with any company whose stock is mentioned in this article. Additional disclosure: Investors are always reminded that before making any investment, you should do your own proper due diligence on any name directly or indirectly mentioned in this article. Investors should also consider seeking advice from a broker or financial adviser before making any investment decisions. Any material in this article should be considered general information, and not relied on as a formal investment recommendation.