Tag Archives: alternative

My New Years Resolution: Balance My Risky Portfolio
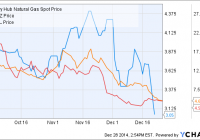
Summary As a young investor my portfolio is filled with risk. In 2015 I will be looking to limit my exposure to big risks. My portfolio was weighted heavily in oil and gas, which did not make for a pretty 2014. Thomas Jefferson once said “With great risk comes great reward.” This certainly is not always the case and my portfolio did most definitely did not agree with this statement in 2014. Since I’m quite young I can afford to have a large amount of risky plays in my portfolio which led to an interesting and ultimately dismal 2014. In 2015 I plan to, as best I can, de-risk my holdings, while still incorporating the right amount of risk for my age. A Few Current Positions For starters, in addition to covering the oil and gas sector heavily, my portfolio has been weighted toward the industry more than any other. You can imagine what this weight has done since the summer. One of my holdings in the industry is small cap Bakken producer Emerald Oil (NYSEMKT: EOX ). The company has operationally and financially improved dramatically since I first added shares but still remains an extremely risky play, especially with the current oil environment. I have averaged down on the name as the company has greatly scaled back its operations in this environment which should enable it to survive the downturn. On a different note, one of my other oil and gas names is a far less risky play. Gran Tierra Energy (NYSEMKT: GTE ) is a Canadian company with operations mainly in Colombia and Peru. The reason I say this is a significantly less risky play is the fact that at the end of Q3 the company continued to have no debt and $360M in cash. Its revised 2015 capex plan only calls for $310M. So while oil is at these depressed levels, Gran Tierra might just be in one of the best positions to ride it out. Along with that the company has several other catalysts. The company should announce soon, or with Q4/FY results, how the initial drilling in Peru is coming along. This will result in significant additions to the company’s reserves and ultimately will add a lot to its overall value. My only main concern with Gran Tierra while I have held it has been the ongoing conflict in Colombia. The FARC rebel group targets lots of infrastructure, including pipelines and rail lines which have in the past disrupted operations. This concern however has been quelled for the time being as the FARC announced a unilateral ceasefire that started December 20th. In 2015 I plan to maintain my current position in energy as I do not need to add more weight to my portfolio and to exit underwater positions would not make sense. Another risky portion of my portfolio includes a sizeable position in J.C. Penney (NYSE: JCP ). I’ve been playing the turnaround for some time now, and in the time I have held it the company has improved its quarterly results greatly. While I do believe in the turnaround working to some extent, depending on Q4 results, I may opt to close this position. Safer plays have become far more attractive than the troubled retailer, and I believe I’m ready to add more practical holdings. A position that I will most definitely be holding onto is Sirius XM (NASDAQ: SIRI ). I have held this position longer than any other, and it was in fact one of the first things I bought when I first began investing a few years ago. The company continues to perform well and I for one am a fan of the buybacks the company has been doing. Earlier in the year I was pleased that the deal with Liberty fell through because I see far greater upside without a buyout for a company with little comparable competition. One last higher risk name I also own is Synta Pharmaceuticals (NASDAQ: SNTA ). It is a small biotech that is engaged in many trials of various drugs, in particular its leading candidate, Ganetespib, which fights cancer. While obviously this further adds diversification to my holdings, Synta is only in trial stages of its drugs, and expects itself to have cash just through Q4 of 2015. This is worrisome because if the results from the trials in 2015 are poor it could see the shares free fall. Don’t get me wrong, I still believe in all of my current holdings. I’m just worried about how balanced I am between safer more reliable plays and high risk plays. In 2014 the market was quite good and that can be seen from the various indexes being up nicely. I’m sure you’ve heard the famous Warren Buffett quote a million times before but here it is once more: “Be fearful when others are greedy and greedy when others are fearful.” Now I can’t tell you where the market will go in 2015 and I’m not saying be fearful or greedy. I’m just highlighting the uncertainty and what my plans are for 2015. Positions I’m Considering When looking at my holdings going into 2015 I see one major problem that I want to fix: no companies I own pay dividends. I did for some time own Bank of America (NYSE: BAC ), but sold it part way through the year (a position in hindsight I wished I kept). My new strategy in 2015 will most definitely include a few and maybe many strong dividend payers. The first of which I am considering would be AT&T (NYSE: T ). With a 5.5% yield it is very enticing. The company continues to deliver some dividend growth announcing yet another increase a couple of weeks ago. I see the acquisition of DIRECTV (NASDAQ: DTV ), which is still pending, as a strong catalyst for further growth going forward. Another mega cap I’m considering is Pfizer (NYSE: PFE ). The company sports a 3.5% yield and also just announced that it was increasing its dividend yet again. In late October the company announced that it would buyback another $11 billion worth of its shares. A couple of other dividend paying names that I am considering adding include Flowers Foods (NYSE: FLO ), Ford (NYSE: F ), and Middlesex Water (NASDAQ: MSEX ). Some Risky Additions in 2015? Although I want to balance my holdings to safer plays that does not mean I won’t add some further risk to it. Over the past two weeks natural gas has been hammered and I see a possible very enticing risk vs. reward opportunity playing natural gas at these levels. This could turn out especially rewarding if we see bitter weather in late January or February. Henry Hub Natural Gas Spot Price data by YCharts Another position I may consider would be one in Twitter (NYSE: TWTR ). In 2015 the company is expected to become consistently profitable after many quarters of losses. The shares are trading 46% down from its 52 week high and the last time the shares were trading around this level they went on a 50% run. A short term catalyst for the shares may be the rumors that current CEO Dick Costolo may be canned. Costolo has lost investor confidence and replacing him could lead to a nice pop in the shares. Conclusion Being so young I can afford to have lots of risk and make mistakes (and learn from them). In 2015 I want to be more cautious and reasonable. Since beginning investing my holdings have always overwhelmingly been dominated by high risk names. To start 2015 I have saved enough to change this and will not only be adding more reliable and safe names, but will also be getting rid of some of the current risky names I hold. In particular I am going to add extremely financially sound companies that also pay dividends which should reward even if 2015 turns sour for the markets. Editor’s Note: This article covers one or more stocks trading at less than $1 per share and/or with less than a $100 million market cap. Please be aware of the risks associated with these stocks. Additional disclosure: Always do your own research before investing. Keep in mind that everyone, especially by age group, has different investment goals and aims. Most of my investments remain long term but I also dabble in short term trading occasionally. I may initiate long positions in T, PFE, UGAZ, GASL, F, FLO, MSEX, TWTR.
How Would A Portfolio Based On The Most Followed SA Stocks Have Performed In 2014?

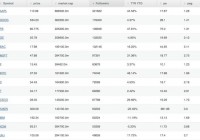
Summary In this article we examine how a portfolio created from the most followed stocks on Seeking Alpha would have performed in 2014. We create three portfolios: equal weighted, weighted based on the number of followers and weighted based on market cap. How did the portfolios do? Read on to see the results. The Most Followed Stocks The SA 30 in order of popularity: (click to enlarge) (click to enlarge) Total_Return data is from Morningstar (1/1/2014 – 12/26/2014), except for GOOG, which is from Y-CHARTS. Sixteen Dow components make the list: T, CAT, CVX, CSCO, KO, XOM, GE, IBM, INTC, JNJ, JPM, MCD, MSFT, PFE, PG and VZ. By Sector the Portfolio breaks down as follows: Basic Materials: COP, CVX and XOM Consumer Goods: PG, F, AAPL and KO Financial: BAC, C, JPM, NLY and WFC Healthcare: PFE, JNJ and GILD Industrial Goods: GE and CAT Services: MCD, NFLX and SBUX Technology: T, VZ, YHOO, MSFT, GOOG, IBM, INTC, FB, and CSCO Performance (click to enlarge) (click to enlarge) Thirteen of the 30 stocks outperformed SPDR S&P 500 Trust ETF (NYSEARCA: SPY ) Year to Date. The equally weighted portfolio has a Total Return YTD of: 11.67% The equally weighted portfolio current yield is: 2.56% Technology companies lead the best performers with INTC, FB, AAPL, MSFT, CSCO and YHOO leading the pack. Five companies have negative Total Return YTD: GE, XOM, CVX, NFLX, IBM and AMZN. The equal weighted portfolio under performs SPY by a significant margin, returning 11.67% compared to 15.06%. It does have a respectable yield of 2.56%. A portfolio weighted by number of followers: Stock Percentage of Portfolio Apple (OTC: AAPL ) 15.62% Google (NASDAQ: GOOG ) 8.56% Facebook (NASDAQ: FB ) 5.34% General Electric (NYSE: GE ) 5.02% Bank of America (NYSE: BAC ) 4.96% Microsoft (NASDAQ: MSFT ) 4.73% Ford (NYSE: F ) 3.93% Intel (NASDAQ: INTC ) 3.59% Citigroup (NYSE: C ) 3.50% AT&T (NYSE: T ) 3.36% Cisco (NASDAQ: CSCO ) 3.29% Amazon (NASDAQ: AMZN ) 3.07% International Business Machine (NYSE: IBM ) 3.02% Exxon Mobil (NYSE: XOM ) 2.44% Johnson & Johnson (NYSE: JNJ ) 2.36% Verizon (NYSE: VZ ) 2.28% Pfizer (NYSE: PFE ) 2.09% Coca-Cola (NYSE: KO ) 1.92% JPMorgan Chase (NYSE: JPM ) 1.88% Yahoo! (NASDAQ: YHOO ) 1.84% Starbucks (NASDAQ: SBUX ) 1.83% Procter & Gamble (NYSE: PG ) 1.82% Annaly Capital Management (NYSE: NLY ) 1.80% Gilead Sciences (NASDAQ: GILD ) 1.78% Wells Fargo (NYSE: WFC ) 1.76% Caterpillar (NYSE: CAT ) 1.66% Chevron (NYSE: CVX ) 1.66% McDonald’s (NYSE: MCD ) 1.64% ConocoPhillips (NYSE: COP ) 1.63% Netflix (NASDAQ: NFLX ) 1.61% The Total Return YTD of the SA 30 weighted by followers: 16.9% SA 30 weighted by followers yield: 2.15% Weighting by number of followers provides better returns and beats SPY with returns of 16.9% compared to 15.06%. This portfolio is not very diverse with AAPL making up 15.62% (no wonder there are so many articles about AAPL) and the top four holdings make up over a third of the portfolio. Portfolio Weighted by Market Cap: Stock Percentage of Portfolio Apple 11.31% Exxon Mobil 6.68% Microsoft 6.68% Google 6.13% Johnson & Johnson 4.98% Wells Fargo 4.85% General Electric 4.38% Procter & Gamble 4.27% JPMorgan Chase 3.96% Facebook 3.81% Chevron 3.62% Pfizer 3.37% Verizon 3.36% Bank Of America 3.32% Coca Cola 3.18% Intel 3.07% AT&T 3.00% Citicorp ( C ) 2.79% International Business Machine 2.72% Cisco 2.45% Amazon 2.42% Gilead Sciences 2.39% McDonald’s 1.56% ConocoPhillips 1.46% Starbucks 1.05% Ford 1.01% Caterpillar 0.97% Yahoo! 0.82% Netflix 0.35% Annaly Capital Management 0.18% The Total Return YTD of a portfolio weighted by Market Cap: 15.27 Market weighted Portfolio Current Yield: 2.32% The portfolio weighed based on Market Cap narrowly beats SPY: 15.27% to 15.06%. This portfolio is also lacking in diversity with the top four holdings making up over 30% of the portfolio. Dividend Data (click to enlarge) All dividend data is from Seeking Alpha The list contains seven dividend aristocrats: T, CVX, KO, XOM, JNJ, MCD and PG. The same seven stocks are also dividend champions. Dividend Contenders or Challengers: COP, VZ, IBM and SBUX Of these eleven stocks that made at least one of the above lists only two outperformed the SPY for total return YTD: PG and JNJ. A fluke or were these best of breed DGI stocks overbought coming into 2014? Eleven of the stocks have yields of 3% or greater: NLY, T, VZ, COP, CVX, GE, MCD, PFE, F, XOM and CAT. Conclusions Overall the most followed stocks on SA had uninspiring performance. With equal weighting the top 30 underperformed the SPY. Weighted by number of followers they did better – but not significantly. From my perspective, this is not that surprising; although I believe the SA crowd as a whole is an intelligent investment community, it’s hard to outperform when selecting stocks that are so closely followed. Others may come to different conclusions – please comment I’d like to know what you think. Ideally I would have liked to do this based on the most followed stocks as of January first of 2014, I unfortunately did not have that data. My plan is to periodically report on this portfolio in 2015 so we can get a better calibration of how the most followed stocks at the beginning of the year perform going forward. I did not check the number of followers for every ticker in the SA stock universe. I checked the entire S&P 500 and a few hundred others. If anyone believes that I have missed a stock that should be in the Top 30, please let me know. I selected 30 stocks to match the number of stocks in the DJI. I can be convinced to add more if readers feel it would be useful. Obviously there is more data and inferences that can be made about these stocks – if you have any particular requests let me know. I am not a professional advisor or researcher. I am an individual investor who studies investing and shares my thoughts. I encourage all investors do their own due diligence and please share your findings. I strongly feel the best thing about Seeking Alpha is the sharing of ideas. Please comment; I value your input. Divergent opinions are welcome. Editor’s Note: This article discusses one or more securities that do not trade on a major exchange. Please be aware of the risks associated with these stocks.

There Is Great Diversification For SPHB, But It Still Carries Some Major Risks

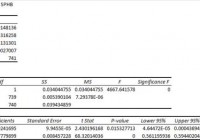
Summary I’m taking a look at SPHB as a candidate for inclusion in my ETF portfolio. The risk level makes me uncomfortable for anything over 5%. The ETF is very well diversified, just not into the kind of companies I want to hold. I’m not assessing any tax impacts. Investors should check their own situation for tax exposure. Investors should be seeking to improve their risk adjusted returns. I’m a big fan of using ETFs to achieve the risk adjusted returns relative to the portfolios that a normal investor can generate for themselves after trading costs. I’m working on building a new portfolio and I’m going to be analyzing several of the ETFs that I am considering for my personal portfolio. One of the funds that I’m considering is the PowerShares S&P 500 High Beta Portfolio (NYSEARCA: SPHB ). I’ll be performing a substantial portion of my analysis along the lines of modern portfolio theory, so my goal is to find ways to minimize costs while achieving diversification to reduce my risk level. What does SPHB do? SPHB attempts to track the total return of the S&P 500® High Beta Index. At least 90% of funds are invested in companies that are part of the index. SPHB falls under the category of “Mid-Cap Blend”. Does SPHB provide diversification benefits to a portfolio? Each investor may hold a different portfolio, but I use (NYSEARCA: SPY ) as the basis for my analysis. I believe SPY, or another large cap U.S. fund with similar properties, represents the reasonable first step for many investors designing an ETF portfolio. Therefore, I start my diversification analysis by seeing how it works with SPY. I start with an ANOVA table: (click to enlarge) The correlation is about 86%. It is low enough to provide some diversification benefits relative to holding SPY, but the benefits won’t be huge so if the standard deviation of returns is too high it may still be difficult to fit SPHB into a portfolio. Standard deviation of daily returns (dividend adjusted, measured since January 2012) The standard deviation is terrible. For SPHB it is 1.1739%. For SPY, it is 0.7300% for the same period. SPY usually beats other ETFs in this regard, but that is a very high standard deviation. Granted, it should be assumed that a high beta portfolio would have a high standard deviation of returns. Under CAPM (Capital Asset Pricing Model) the level of expected return should be easily determined by the beta of the stock. I think high beta stocks frequently more risk than they compensate for with returns. Therefore, I have a bias towards lower levels of beta. In the context of an entire portfolio, I can see the potential for benefits from using a small position in higher beta ETFs with free rebalancing to limit the amount of risk being created. Mixing it with SPY I also run comparisons on the standard deviation of daily returns for the portfolio assuming that the portfolio is combined with the S&P 500. For research, I assume daily rebalancing because it dramatically simplifies the math. With a 50/50 weighting in a portfolio holding only SPY and SPHB, the standard deviation of daily returns across the entire portfolio is 0.9359%. If we drop the position to 20% the standard deviation goes down to .8068%. In my opinion, that’s still too high. Once we drop it down to a 5% position the standard deviation is .7484%. I think 5% is about the largest position I’d consider here. Why I use standard deviation of daily returns I don’t believe historical returns have predictive power for future returns, but I do believe historical values for standard deviations of returns relative to other ETFs have some predictive power on future risks and correlations. Yield & Taxes The distribution yield is 0.88%. The ETF isn’t designed to cover the living expenses of retirees and in my opinion the risk level of the ETF combined with the low yield should encourage retirees to only consider positions even smaller than 5%. With the right level of diversification the ETF can still be used, but it isn’t built to meet those needs. I’m not a CPA or CFP, so I’m not assessing any tax impacts. If I were using SPHB, I would want it to be in a tax exempt account to remove any headaches associated with frequent rebalancing. Expense Ratio The ETF is posting .25% for an expense ratio. I want diversification, I want stability, and I don’t want to pay for them. In my opinion, a .25% expense ratio is higher than I want to pay for equity investments. It’s still low relative to many other methods of investing, but I’m looking for long term holdings and I don’t want to give my investments away. Market to NAV The ETF is at a .03% premium to NAV currently. In my opinion, that’s not worth worrying about. It is practically trading right on top of NAV. However, premiums or discounts to NAV can change very quickly so investors should check prior to putting in an order. Largest Holdings The portfolio is very well diversified. Despite my lack of interest in holding higher beta portfolios, I still appreciate the great level of diversification. The top holding is barely over 1.5% of the portfolio. That is great. Check out the chart below: (click to enlarge) Conclusion I’m currently screening a large volume of ETFs for my own portfolio. The portfolio I’m building is through Schwab, so I’m able to trade SPHB with no commissions. I have a strong preference for researching ETFs that are free to trade in my account, so most of my research will be on ETFs that fall under the “ETF OneSource” program. At this point I’m a little skeptical, but I’ll have to test the impacts of the ETF in a heavily diversified portfolio. If I do include SPHB, it will probably be a position of 5% or less. The most likely result is that I will decide to exclude SPHB from my portfolio.