Tag Archives: alternative

GDX – The Way To Play Gold In 2015

Summary I anticipate gold will stabilize and turn higher during 2015. Over the near-term, the factors weighing against gold remain capable of hampering its price appreciation. I would avoid the risk inherent in owning individual miners, save for the most stable, and instead seek the leverage of the miners through GDX. Gold’s great fall of the past two years has been well-documented, and many experts see good enough reason for it to continue a while longer. However, I see the dynamics around the price of gold shifting. Given the greater swing lower of gold miners versus the price of gold, they may be priced right to benefit in a greater way from a turn in trend. Many of the miners are small and some are over-levered and vulnerable to further decline in the price of the commodity. So for the wherewithal to survive any further downswing while still availing capital to benefit from an upward move in gold, I suggest investors consider the Market Vectors Gold Miners ETF (NYSE: GDX ) here. I think that it’s one of the best ways to play for a turn in gold. Gold Past and Present I just published my expectations for gold in 2015 in a report formally marking my change in opinion about its direction. It is required reading for those studying this report, but I am summarizing it again here for those of you who might not get a chance to look at it. Then we can move forward to why I believe the Market Vectors Gold Miners ETF is a prime way to play gold in 2015. Gold prices came down significantly in 2013 and 2014, and gold relative securities followed. I believe it is popular opinion now that anticipation about the change in Federal Reserve monetary policy from expansionary to hawkish is what drove the start of the decline in gold prices in 2013. 2014 proved to be choppy for reasons discussed in my outlook report, but gold finally also found ultimate direction lower in 2014 as well. The key catalyst for that decline was the strengthening dollar, which anticipated and reacted to Fed action to halt quantitative easing. The dollar remains strong against relatively weaker currencies globally due to American economic strength and Fed monetary direction versus economic difficulties in Europe, Japan and elsewhere, and dovish central bank policy at the Bank of Japan (BOJ) and European Central Bank (ECB). To start 2015, and beginning already, I see capital flows out of better performing securities finding gold as investors seek to guard wealth again from the tides of tax relative flows. Before long, I expect a new question to be raised about the status of the dollar as a safe haven for wealth. Despite strong economic growth in the U.S. and relatively weaker activity overseas, I see geopolitical conflict somehow infecting our shores, and possibly our economy and currency in 2015. That risk alone already has sovereigns flirting with moves toward a gold standard. Some are making the change out of necessity, like Russia and Iran, but others will do so out of preference. I see this as a prelude to a future trend. The key catalyst for the dollar is likely tiring at this point. I believe the dollar has already greatly priced in the start of Fed rate hikes coming in 2015. So, a sell the news type of scenario could play out with the dollar shedding value and gold and other commodities seeing renewed price strength in 2015, especially if the dollar’s safe haven status is placed into question as I expect. Please read my report for more detail on my view for gold. Gold Miners Decline and Position Gold Relative Securities YTD SPDR Gold Trust ETF (NYSE: GLD ) -4.4% iShares Silver Trust ETF (NYSE: SLV ) -19.4% Market Vectors Gold Miners -15.4% Goldcorp (NYSE: GG ) -17.9% Newmont Mining (NYSE: NEM ) -21.7% Barrick Gold (NYSE: ABX ) -42.3% Kinross Gold (NYSE: KGC ) -39.7% Randgold Resources (NASDAQ: GOLD ) +0.4% Yamana Gold (NYSE: AUY ) -55.4% You can see how gold miners have exaggerated the price decline of gold in the comparison of the miners’ performance to the SPDR Gold Trust ETF, which tracks the price of gold. The miners are off by a significantly greater margin this year-to-date; the miner-encompassing Market Vectors Gold Miners ETF is down 15.4% versus the 4.4% slide in the GLD this year. However, the declines of most of the individual gold miners’ shares have been far greater. Even the industry leaders are off by a greater margin than the GDX. This illustrates how levered the gold miners are to the price of gold, both individually and as a group, but it also shows how risk can be reduced by using the GDX versus individual miners. Why GDX Over Miners Yamana Gold is down more than 55% this year, versus the 15.4% drop of the GDX. That’s because Yamana has 29X more debt than equity, and threshold where it becomes unfeasible for it to produce gold. It’s thereby vulnerable to swings in the price of gold and bears company specific liquidity and solvency risk. This would be the case across a swath of miners, and individual exploration and production results could disappoint as well. However the Market Vectors Gold Miners ETF allows the investor to eliminate company specific risk, or at least minimize it. The ETF seeks to match the performance of the NYSE Arca Gold Miners Index. While the GDX may hold the shares of small cap miners, its holdings are part of a diversified portfolio of firms within the mining industry. Therefore, if one miner goes bankrupt or produces poor results, the GDX will not see much price impact. It allows investors to bet on the leverage inherent in gold miners to the price of gold but to reduce the risk that exists in holding one company. Similarly to the year-to-date performance shown in the table above, the five-year charts of the GLD and the GDX show that gold miners have exaggerated the move downward in gold. I believe this reflects a sort of inverse bubble in the miners, where downside has been overdone and the shares are oversold. If we were to put the two charts together, we would see that a wide gap has opened between the struggling GDX and the valuation of the GLD. I expect it to close that gap once gold prices begin a sustainable move higher. Given my view that gold prices will stabilize and begin to move higher in the coming year, I favor long-term investment in gold relative securities. As there remain risks to the price of gold, I would refrain from investment in individual gold miners due to company specific risks, save for the largest and most stable of the firms. Instead, I suggest the Market Vectors Gold Miners security as the way to best lever the turn in gold I see, without bearing the risks inherent to individual miners.
5 Hedge Ideas To Protect Your Portfolio

PTT’s Yellow Alert immediately preceded the largest one-week market decline in years. PTT Research has sold most of its speculative and tertiary positions. PTT Research is keeping its Core positions. Suggestions on how and what to hedge in order to protect your portfolio. By Scott Moses Murray & Mark Gomes Recently, PTT Research Chief Analyst Mark Gomes issued a Stock Market Yellow Alert . These are fairly rare. We publish them when the market is frothy and excessively bullish or when it is showing signs of deterioration. The latter characterizes the market today. Paying subscribers received the alert on December 8th, one trading day after the S&P hit its all-time high. SPY has since fallen over 4%. Our last article discusses the conditions that prompted Mark to issue the alert. Today we will discuss ways to hedge your portfolio to protect against loss. According to the PTT Methodology , a Yellow Alert is a signal to go on the defensive. To do this, we keep the shares of official PTT picks and any other core holding we may have, but we protect ourselves by selling tertiary (non-important) holdings and putting hedges in place. To be clear, Mark does not recommend selling QAD Inc. ( QADA), Mattersight Corporation ( MATR), Glu Mobile (NASDAQ: GLUU ), JAKKS Pacific, Inc. ( JAKK), or Aero Grow International, Inc. ( AERO). He remains bullish on each of these businesses and believes their shares are undervalued, regardless of market action. In fact, he was a buyer of MATR and AERO as the market tumbled. Even during a correction, any of these companies might be acquired for a large premium over its share price today. The entire market, meanwhile, will not be acquired tomorrow for a large premium. When the market is at risk, we sell the market. We have conviction in our core positions, so we hold onto them. To protect our core positions when market risk is high, we put a full hedge in place. There are many ways to hedge. When you invest in PTT picks, you follow a strict Methodology. This is not exactly the case with hedging. It is more an art than a science. You have flexibility. It’s not so important how you hedge, but it is important that you hedge. To be fully hedged means for your hedges to have roughly the same beta-weighted value as your long positions. We won’t explain beta-weighting in depth because you can look it up easily enough, but here is a brief version. Each of your stocks has a beta, its measure of volatility relative to the indices on which it trades. If you want to fully hedge a long position, multiply its dollar value by the stock’s beta. The product of this multiplication is the dollar value you would short of the index ( IWM , QQQ etc.) to create a full beta-weighted hedge. Keep in mind that markets outside the US are also vulnerable. They make good hedges even if your stocks don’t trade there. With that in mind, here are some hedges you may want to consider. Short SPY, which tracks the S&P. If you are uncomfortable being a short-seller, buy HDGE , an ETF which shorts the market for you and goes up when the market goes down. Short EEM , which tracks emerging markets. Emerging markets typically depend on foreign investment, which flees to safety when the market looks unstable. Buy UUP , which tracks the US dollar. A beneficiary of flights to safety, the dollar tends to do well when markets fall. Short FXI , an ETF that tracks China. PTT subscribers are also shorting individual stocks that Mark’s research shows have fundamental reasons to decline regardless what the market does. A final word to the wise. This is not a Red Alert, but Mark believes conditions developing now may result in a fundamental breakdown in the market. He has issued only two Red Alerts in his career: one in 2000 and one in late 2007. A Yellow Alert is not a cause for panic. Three Yellow Alerts in 13 months imply that it is a time for caution, however. Mark plans to issue a number of market updates to PTT subscribers as events unfold, along with some picks that are Poised to Plummet-stocks that you can profit from by shorting. Visit us at www.pttresearch.com . Editor’s Note: This article covers one or more stocks trading at less than $1 per share and/or with less than a $100 million market cap. Please be aware of the risks associated with these stocks.

Dallas Fed Fisher’s Prescience And GLD

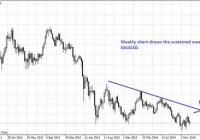
Recent third quarter GDP growth of 5% at 11 years high brings credibility to Fisher’s bullish dissent which is unforeseen by the FOMC. This brings greater possibility of an earlier rate hike forward to the March or April 2015 meeting especially if it is reflected in the upcoming labor figure. GLD paused its decline in this quiet festive market. This is the time to go short GLD before the market resumes fully in the second week of 2015. Voting against the action were Richard W. Fisher, who believed that, while the Committee should be patient in beginning to normalize monetary policy, improvement in the U.S. economic performance since October has moved forward, further than the majority of the Committee envisions, the date when it will likely be appropriate to increase the federal funds rate.” The quote is extracted from the statement of the Federal Open Market Committee (FOMC) released on 17 December 2014 . Dallas Federal Reserve President Richard Fisher took on a more bullish stance than the rest of the committee. During the meeting, the FOMC took reference from the October 2014 economic data and came to a bullish stance where you can read on my previous article ‘ Dissents At The December 2014 FOMC Meeting Hints At Earlier Rate Hikes ‘. At that point, I was not very convinced about Fisher’s outlook as I believe were the case of the rest of the FOMC. The US were showing some strong number such as the November 2014 non farm payroll of 321,000 which is better than the previous reading of 243,000 and expectations of 231,000 and average hourly earnings increase of 0.4% over 0.1% in October and 0.2% of market expectations. However there were misses as well such as the 0.3% contraction of the consumer price index in November after no change in October. Flash manufacturing purchasing manager index came in lower at 53.7 in November compared to a 54.8 reading in October and market expectations of 56.1. However with the 23 December 2014 revision of the third quarter 2014 from 3.9% to 5.0% which is not seen in 11 years since the third quarter of 2003, I am beginning to think that Fisher might be prescient in his observation. The FOMC will meet again next month from 27 to 28 January 2015. They will observe that GDP grew by 5.0% in the third quarter of 2014, at a 11 year high and agree with Fisher’s observation. During Chair Janet Yellen’s latest press conference , she had the following projection about GDP growth: The central tendency of the projections for real GDP growth is 2.3 to 2.4 percent for 2014, up a bit from the September projections.” The fact that GDP grew at such a rapid rate should persuade the Fed to raise rates at an earlier date perhaps in the March or April meetings instead of the June meeting as widely expected in the market. This would be so especially if there is continued improvement in the labor market. Hence we should keep a lookout for 09 January 2015 figures for the non-farm payroll and unemployment rate data. During the same press conference, Yellen set an unemployment target of 5.2% to 5.3% in the quote below: The central tendency of the unemployment rate projections is slightly lower than in the September projections and now stands at 5.2 to 5.3 percent at the end of next year, in line with its estimated longer-run normal level.” However I don’t think that the FOMC would start rising rates when unemployment rate is at 5.2% -5.3%. Instead I am of the opinion that they would start to rise rates as unemployment start to move towards their target as GDP grows. This would obviously be bullish on the United States Dollars (USD) after the market returns from the holiday season on the second week of 2015. Then I turned my thoughts to gold. You might have heard of this argument in one form or another before but it is worth repeating. As the US rises interest rates, it will be more expensive to hold onto gold as it gives no return and in fact cost you in terms of insurance and storage if you were to hold physical gold. Of course, there is the theory that holding gold is an insurance against the economic collapse but this is getting less and less traction especially with GDP growth of 5%. Then there is the argument that gold is a hedge against inflation but inflation is low and even the Fed foresees 1.0% to 1.6% inflation for 2015 if you refer to Yellen’s press conference. However, today I am going to offer a slight twist to it. The USD has not responded much to the record 11 year high GDP reading. You can read about it in my article ‘ USD Asleep As Q3 2014 GDP Hits 11 Years High ‘. In normal trading day, we would have seen USD raise by at least 100 pips but today if you are reading it before the market returns from the holiday, you might be in a position to short gold at a good price as gold gains partial strength by default after sustained selling in the past week with a lesser possibility of being hit by a retracement. Even if you miss the chance to sell gold by the time you read it, you can also sell it but with a wider stop loss. You can take the daily volatility as a guide. (click to enlarge) (click to enlarge) The 2 charts above shows the weekly and daily chart of XAU/USD. XAU is the symbol for gold while USD represents United States Dollar which we are all familiar with. The weekly chart shows that this pair is under constant pressure even if there are periodic upticks. The current weekly chart looks like it is on the downtrend after completing its recent bounce to a high of $1238 two weeks back. The daily chart shows us that the XAU/USD is having one of its uptick but this is likely to be temporary. This is a function of the thin trading market during the festive season and traders can take this opportunity to sell and set their stop loss at $1230. Of course, there is no sure thing in trading and one should set the position size accordingly. For those who want to avoid the leverage inherent in forex, they should use the SPDR Gold Trust ETF (NYSEARCA: GLD ) instead. GLD is listed on the New York Stock Exchange and highly liquid with $26.90 billion of market capitalization and transaction volume of 1.5 million shares. (click to enlarge) The chart above shows the weakness of the GLD after the peak 2 weeks back which is an interim retracement. Now is the time to go short the GLD as it pauses before its downtrend and catch the trend before it slowly resumes again next week.