Selecting An Emerging Markets Value ETF
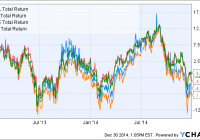
Summary Emerging markets have struggled over the past several years and may deserve a second look today. Value is a validated factor for outperformance that also works in emerging markets. This article analyzes three emerging market value ETFs in comparison to the benchmark EEM. Introduction In a previous article on emerging market low-volatility ETFs, we remarked that emerging markets had performed very well for most of the last decade, but have struggled coming out of the financial recession. This has made emerging markets one of the two cheapest global regions today (the other is Asia ex-Japan). Besides low volatility, “value” is an another factor that has been documented to lead to stock outperformance. In a recent paper from Robeco Asset Management, value, low-volatility, size and momentum premia were (re)confirmed to exist in emerging markets. Therefore, I was also interested to analyze the composition of several emerging market value ETFs to see which would be the best one to include in my own portfolio. Emerging market value funds The emerging market (EM) value funds under consideration are: iShares MSCI Emerging Markets Value ETF (NASDAQ: EVAL ), PowerShares FTSE RAFI Emerging Markets Portfolio (NYSEARCA: PXH ), and FlexShares Morningstar Emerging Markets Factor Tilt Index Fund (NYSEARCA: TLTE ). The benchmark iShares MSCI Emerging Markets ETF (NYSEARCA: EEM ) is also included for comparison. EVAL seeks to track the investment results of an index composed of emerging market equities that exhibit value characteristics. RAFI is fundamental-weighted ETF that selects and weights securities based on book value, cash flow, sales and dividends. TLTE seeks to enhance exposure to emerging markets by tilting the portfolio towards small-cap and value stocks. Fund details Data for EVAL, PXH, TLTE and EEM are shown below (source: Morningstar ). EVAL PXH TLTE EEM Yield 2.12% 3.05% 0.82% 1.69% Expense ratio 0.49% 0.49% 0.65% 0.67% Inception Feb 2012 Sep 2007 Sep 2012 Apr 2003 Assets $21.3M $367M $240M $32.2B Avg Vol. 2.7K 137K 21K 60.6M No. holdings 437 317 2057 817 Annual turnover 25% 24% 20% 22% We can see that PXH and TLTE are both relatively small funds, though their liquidity should still be sufficient for the average investor. EVAL is a tiny fund and has very low liquidity, which would result in higher bid-ask spreads. EEM, the benchmark ETF, is a giant by comparison. The expense ratios for the four EM funds are quite high, ranging from 0.49% to 0.67%, which is much higher than for domestic (US) funds. EVAL and PXH are both tied for the cheapest expense ratio at 0.49%, whereas TLTE has a higher expense ratio of 0.65%. The following table shows the top 10 holdings of the four funds. EVAL PXH TLTE EEM China Mobile 3.77 Gazprom 3.61 Samsung Electronics 2.31 Samsung Electronics 3.18 China Construction Bank 2.82 China Construction Bank 2.89 Taiwan Semiconductor Manufacturing 1.98 Taiwan Semiconductor Manufacturing 2.80 Industrial And Commercial Bank Of China 2.58 China Mobile 2.79 Tencent Holdings 1.44 Tencent Holdings 2.05 Bank of China 2.12 Industrial And Commercial Bank Of China 2.63 China Mobile 1.30 China Mobile 1.87 Hon Hai Precision 2.02 Taiwan Semiconductor Manufacturing 2.40 China Construction Bank 1.09 China Construction Bank 1.36 Gazprom 1.76 Bank Of China 2.34 Industrial And Commercial Bank Of China 0.99 Naspers 1.28 Mtn Group 1.62 Itau Unibanco Holding 2.14 Naspers 0.90 Industrial And Commercial Bank Of China 1.25 CNOOC 1.34 Petroleo Brasileiro 2.13 Itau Unibanco Holding 0.75 Itau Unibanco Holding 1.03 Hyundai Motor 1.27 Hon Hai Precision Ind 2.02 America Movil 0.74 Bank of China 1.02 Sasol 1.20 Reliance Industries 2.00 Bank Of China 0.70 America Movil 0.99 We can see these funds have quite a few of their top 10 holdings in common. Overlap The following table illustrates the overlap between the three EM value funds and EEM. Overlap statistics were obtained from ETF Research Center . EVAL PXH TLTE EEM EVAL – 49% 33% 52% PXH 49% – 35% 49% TLTE 33% 35% – 56% EEM 52% 49% 56% – We can see that there is a significant degree of overlap between the four funds. The three EM value funds have 33%-49% overlap between themselves, and 49%-56% overlap with EEM. In comparison, the low-volatility EM funds only had 2-31% overlap with EEM. The highest overlap is between TLTE and EEM (56%), while the lowest is between TLTE and EVAL (33%). Performance The graph below shows the performance of the three EM value funds and EEM since Dec. 2012 (2 years). EVAL Total Return Price data by YCharts We can see that the performances of the four funds have been relatively similar over the past two years. EEM has had the highest performance of -1.01%, followed by TLTE at -3.53% and EVAL at -4.25%. PXH had the worst return of -7.19%. The similar performances of the funds could be due to their significant amount of overlap between them. The following table shows further performance and risk data for the three EM value funds and EEM. Data are from Morningstar, except for volatility (2Y) and beta (2Y) which are from InvestSpy . EVAL PXH TLTE EEM 1-year return % -3.26 -5.59 -5.64 -3.04 3-year return (ann.)% – 0.01 – 3.22 5-year return (ann.)% – -1.96 – 0.93 Volatility (2Y) % 25.7% 18.2% 15.1% 17.3% Beta (2Y) 0.57 1.09 0.86 1.09 Sharpe ratio (3Y) – 0.15 – 0.37 Sharpe ratio (5Y) – 0.11 – 0.22 Surprisingly, EVAL apparently has a very high volatility compared to the other three funds, but a very low beta. However, I’m not sure if those metrics are reliable because EVAL is quite illiquid. When comparing PXH with EEM, we can see that the two funds have similar volatilities and betas. However, PXH has had a worse long-term performance. Valuation The table below shows various value and growth metrics for EVAL, PXH, TLTE and EEM. Data for all funds are from Morningstar (value metrics including dividend yield are forward looking). The first five rows can be considered as value metrics while the last five rows can be considered as growth metrics. EVAL PXH TLTE EEM Price/Earnings 10.06 9.51 11.78 12.76 Price/Book 1.08 1.02 1.26 1.49 Price/Sales 0.92 0.76 0.9 1.14 Price/Cash Flow 4.96 4.14 4.3 4.92 Dividend Yield % 3.62% 3.66% 2.72% 2.56% Projected Earnings Growth % 10.59 8.47 11.61 11.76 Historical Earnings Growth % -0.08 0.74 -28.77 -1.68 Sales Growth % -19.36 -11.82 -22.17 -13.79 Cash-flow Growth % 1.92 3.08 -3.97 7.85 Book-value Growth % -22.03 -27.25 -26.06 -21.57 We can see from the data above that all of the EM value funds have superior valuation metrics than EEM, as expected. Of the three EM value funds, PXH has the best valuation metrics, followed by TLTE. The funds also appear to have many negative growth metrics, which could be due to the effect of a global slowdown on the growth of many emerging market economies that rely heavily on exports or foreign investment. The EM value funds generally have worse growth metrics compared to EEM. Countries Perhaps the most important factor that would affect the performance of the EM value funds is the distribution of the constituent countries in the fund. The following table shows the top 10 countries in each of the three low-volatility EM funds and EEM (data from ETF Database ). EVAL PXH TLTE EEM China 20.60% China 24.48% China 20.01% China 17.52% Taiwan 12.69% Taiwan 14.54% South Korea 13.10% South Korea 13.64% South Korea 11.86% Brazil 11.30% Taiwan 12.22% Taiwan 12.20% India 7.35% Russia 8.89% India 8.51% Brazil 7.82% South Africa 7.23% South Africa 8.45% South Africa 7.73% South Africa 7.75% Mexico 5.26% India 7.92% Brazil 7.34% India 6.99% Brazil 4.56% Mexico 4.49% Mexico 4.53% Mexico 5.05% Malaysia 3.76% Turkey 3.18% Russia 4.08% Russia 3.94% Russia 3.69% Malaysia 2.54% Malaysia 3.73% Malaysia 3.66% Indonesia 2.70% Thailand 2.51% Indonesia 2.74% Indonesia 2.66% We can see from the above funds that all of them have China as the top holding. Taiwan also ranks prominently in all of the EM funds. South Korea is found as a top holding in all of the EM funds except PXH, probably because the FTSE Emerging Market Index does not include South Korea. I like the country distribution of PXH the most because it has the four cheapest EM countries as the top four holdings: China (PE: 7.1), Taiwan (PE: 13.9), Brazil (PE: 12.4) and Russia (5.5). Size The table below shows the size distribution for the four EM funds (data from Morningstar). EVAL PXH TLTE EEM Giant 49.7 58.6 36.4 50.6 Large 38.0 31.0 28.6 37.0 Medium 11.8 9.6 21.7 11.9 Small 0.5 0.8 13.1 0.4 Micro 0.0 0.0 0.2 0.1 And in graphical form: We can see that TLTE has the most even size distribution, as its investment mandate tilts its exposure towards smaller-cap stocks. EVAL, PXH and EEM have similar size distributions, with giant caps accounting for ~50% weight and large caps accounting for ~30% weight. Sector The final aspect to consider for the EM ETFs is their sector distribution. The following table shows the sector composition of the three EM value funds and EEM. Data are from Morningstar. EVAL PXH TLTE EEM Basic Materials 12.54 9.06 9.45 7.9 Consumer Cyclical 8.96 4.74 10.37 8.46 Financial Services 30.27 32.76 21.87 25.44 Real Estate 2.07 1.2 4.27 2.45 Communication Services 12.63 10.63 5.83 7.77 Energy 11.43 17.33 6.27 7.5 Industrials 5.49 3.85 8.58 5.72 Technology 8.84 13 18.61 20.95 Consumer Defensive 3.91 4.09 7.52 8.28 Healthcare 0.14 0.39 3.01 2.24 Utilities 3.72 2.97 4.23 3.3 And in graphical form: Similar to the low-volatility EM funds described in the previous article, financials again make up the highest allocation of the EM value funds. PXH also has a relatively high allocation towards energy, while TLTE and EEM have higher technology allocations. The following graph shows the sector distribution of the four funds (individual sectors are not marked). We can see that TLTE has the most even sector distribution out of the four funds. Conclusion The three low-volatility funds have had quite similar perfomances over the past two years, which could be due to the relatively high degrees of overlap between the funds. My pick for an EM value fund for my own portfolio was a close call between PXH and TLTE. (Unfortunately EVAL has to be excluded due to its low liquidity). TLTE had better sector and size distributions than PXH, and also exhibited a slightly better performance than PXH over the last two years. However, PXH has a slightly lower expense ratio (0.49%) and superior value metrics compared to TLTE. PXH also pays the highest dividend yield (3.05%) out the four EM funds studied. Finally, PXH contained a greater proportion of its weight in low PE countries. In the end, given that I was looking for an EM value fund, I selected PXH, the more “valuey” of the two funds, for my portfolio.