Tag Archives: alternative

How Strong Is SCHV? I’m Considering It As A Core Holding.
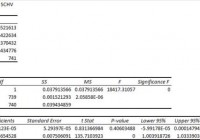
Summary I’m taking a look at SCHV as a candidate for inclusion in my ETF portfolio. The risk level is great, though the high correlation to SPY shouldn’t be a surprise. The ETF has fairly decent yields and a great composition of companies. I’m not assessing any tax impacts. Investors should check their own situation for tax exposure. Investors should be seeking to improve their risk adjusted returns. I’m a big fan of using ETFs to achieve the risk adjusted returns relative to the portfolios that a normal investor can generate for themselves after trading costs. I’m working on building a new portfolio and I’m going to be analyzing several of the ETFs that I am considering for my personal portfolio. One of the funds that I’m considering is the Schwab U.S. Large-Cap Value ETF (NYSEARCA: SCHV ). I’ll be performing a substantial portion of my analysis along the lines of modern portfolio theory, so my goal is to find ways to minimize costs while achieving diversification to reduce my risk level What does SCHV do? SCHV attempts to track the total return of the Dow Jones U.S. Large-Cap Value Total Stock Market Index. At least 90% of funds are invested in companies that are part of the index. SCHV falls under the category of “Large Value”. Does SCHV provide diversification benefits to a portfolio? Each investor may hold a different portfolio, but I use (NYSEARCA: SPY ) as the basis for my analysis. I believe SPY, or another large cap U.S. fund with similar properties, represents the reasonable first step for many investors designing an ETF portfolio. Therefore, I start my diversification analysis by seeing how it works with SPY. I start with an ANOVA table: (click to enlarge) The correlation is about 98%. That’s simply too high to provide a very meaningful diversification benefit. I measure risk with the standard deviation of daily returns. It isn’t perfect, but it works fairly well for my purposes and seems to hold up over time. Because the correlation is very high, the standard deviation of returns will be a fairly significant factor. Standard deviation of daily returns (dividend adjusted, measured since January 2012) The standard deviation is great. For SCHV it is 0.7027%. For SPY, it is 0.7300% for the same period. Since SPY usually beats other ETFs in this regard, I’d look at that standard deviation level as being fairly favorable. Of course, since SPY and SCHV hold several of the same companies a high correlation was pretty much a given. Since the Value side of the index should have more stability and less risk, the findings are in line with my expectations. Mixing it with SPY I also run comparisons on the standard deviation of daily returns for the portfolio assuming that the portfolio is combined with the S&P 500. For research, I assume daily rebalancing because it dramatically simplifies the math. With a 50/50 weighting in a portfolio holding only SPY and SCHV, the standard deviation of daily returns across the entire portfolio is 0.7128%. The value side of the index (which SCHV is tracking) has been outperformed by the growth side of the portfolio. I would expect that to usually happen during a bull market. When a bear market occurs, I would expect the value side to hold up a little better. Since I believe in being fairly defensive about protecting capital, the value side is more appealing to me. Why I use standard deviation of daily returns I don’t believe historical returns have predictive power for future returns, but I do believe historical values for standard deviations of returns relative to other ETFs have some predictive power on future risks and correlations. Yield & Taxes The distribution yield is 2.33%. The SEC 30 day yield is 2.52%. I’m pretty comfortable with this ETF as an investment for retirees so far. In my opinion, it is a fine investment for younger investors as well. I have quite a while to go before retirement, but I still like healthy dividend yielding companies. Investors concerned about tax consequences should seek advice from someone knowledgeable about their tax situation. Expense Ratio The ETF is posting .07% for an expense ratio. This is great expense ratio. I treat the expense ratio as a very important metric when considering an investment. I want diversification, I want stability, and I don’t want to pay for them. Market to NAV The ETF is at a .02% premium to NAV currently. In my opinion, that’s not worth worrying about. It is practically trading right on top of NAV. However, premiums or discounts to NAV can change very quickly so investors should check prior to putting in an order. Largest Holdings The portfolio isn’t really top heavy. There are no holdings over 4%, but I still could go for slightly more diversification. With so many companies over 2%, the low standard deviation speaks to the stability of the companies within the ETF. (click to enlarge) I love having Exxon Mobil (NYSE: XOM ) as the top holding in the portfolio. I want exposure to gas because high gas prices can slow down the rest of the economy. In my opinion, it is hard to make an argument for any portfolio (under modern portfolio theory) that does not contain at least some exposure to gas prices. In my opinion, XOM is a reasonably safe way to get that exposure. You may notice Chevron is also in there. I think that is great as well. I don’t want to hold just one of the major gas companies. In my opinion, this is a fairly solid lineup. I’m still uncomfortable with Verizon (NYSE: VZ ) because I don’t like that industry in the current environment. However, at less than 2%, I have no problem with including it in a long term ETF position. When the industry becomes attractive again, it should be a great company to hold. Conclusion I’m currently screening a large volume of ETFs for my own portfolio. The portfolio I’m building is through Schwab, so I’m able to trade SCHV with no commissions. I have a strong preference for researching ETFs that are free to trade in my account, so most of my research will be on ETFs that fall under the “ETF OneSource” program. I’m finding SCHV pretty attractive and will consider giving it a niche in my portfolio. The size of the position depends on if I decided to use it as a core holding in place of SPY or SCHB. In that scenario, it could end up with a position as large as 20 to 25%. Otherwise, I would probably aim for something around 10%. Before I make a final decision I’ll need to run some analysis on complete potential portfolios. One way or another, my complete portfolio will include strong exposures to large cap U.S. companies and to heavy dividend paying companies.
Clean Energy Fuels: Weighing The Pros Against The Cons

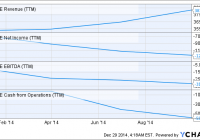
Summary Except for revenue, Clean Energy Fuels saw a decline in other key metrics in 2014. Clean Energy is burning through cash as it invests in infrastructure to tap the natural gas fueling market. Since natural gas-powered vehicles are expected to grow over 20 times in the next six years, it is important for Clean Energy to invest in infrastructure. Clean Energy, however, needs to make a quick turnaround in order to arrest a rapidly rising debt/equity ratio and a declining profit margin. It can be easily concluded that 2014 has been a year to forget for Clean Energy Fuels (NASDAQ: CLNE ), with the stock having depreciated almost 60%. This doesn’t come across as a surprise, because the company’s revenue growth hasn’t led to an improvement in its profitability. In addition, the company is burning through cash. The following chart will give us a bird’s eye view of Clean Energy Fuels’ problematic 2014. CLNE Revenue (NYSE: TTM ) data by YCharts But, the decline in Clean Energy’s net income, EBITDA, and cash from operations isn’t surprising at all as the company operates in an industry that’s making gains at a fast pace. According to Navigant Research , the global market for natural gas vehicles (NGVs) will reach 35 million units by the end of the decade, an impressive increase over 1.5 million units this year. Now, Clean Energy provides fueling infrastructure for these trucks. Considering the rapid pace at which the usage of NGVs is expected to grow in the future, Clean Energy needs to build up its infrastructure. This is the reason why the company’s financial performance has not been up to the mark this year, as it has aggressively invested in its infrastructure. But, the good thing is that it has positioned itself nicely for growth in the future. In fact, in 2015, its loss is expected to drop to $0.83 per share from the expected 2014 loss of $1.07 per share, translating into an improvement of 22.4%. Additionally, its revenue is slated to improve 15%. Moreover, for the next five years, Clean Energy’s bottom line is expected to continue improving at an annual rate of 25%. Factors Driving the Bullish Case The question is: Can Clean Energy actually achieve the expected growth rates? I think it can. The company recently closed two key strategic transactions with Mansfield and NG Advantage , and both these will allow it to tap key growth markets. NG Advantage has a robust compression infrastructure in place. As a result, it can provide cheaper natural gas for the facilities and vehicles of Clean Energy’s customers. Mansfield Energy, meanwhile, is a key behind-the-gate fuel provider in the U.S. It has partnerships with more than 900 petroleum hauling carriers countrywide. Through this venture, Clean Energy will operate closely with Mansfield’s haulers for transitioning their fleets to natural gas. Now, the addressable market opportunity that this joint venture has opened up is worth 3 billion gallons of diesel a year. In comparison, Clean Energy delivered 159 million gallons of natural gas in fiscal 2013. Hence, there is a big market that Clean Energy can tap as a result of the Mansfield deal. Apart from these partnerships, Clean Energy is also spending on the growth of its organic infrastructure. So far this year, Clean Energy has closed 49 station projects, and it has another 28 station projects under development. Driven by these infrastructure improvements, Clean Energy has been able to increase its customer count on the back of improved capacity. For instance, Clean Energy has signed a deal with Dillon Transport, and plans to open three truck-friendly public CNG stations to maintain Dillon’s expanding fleet of 200 natural gas trucks. Once fully deployed, these are expected to use 2.5 million gallons of fuel per year. The Bearish Case However, not everything is rosy about Clean Energy, as the following chart shows: CLNE Profit Margin ( TTM ) data by YCharts Clean Energy’s profit margin has been declining at a very fast pace, while its debt is rising at the same time. Presently, the company has total cash of $248 million, while its debt stands at $619 million. Also, as mentioned earlier in the article, it is burning through cash. The company’s operating cash flow is a negative $58 million in the past one year, while levered free cash flow is also negative at $121 million. Thus, if Clean Energy is unable to make a quick turnaround, its position might deteriorate further. This is a risk that investors need to be aware of. Conclusion As I mentioned in my bullish case, Clean Energy’s bottom line is expected to improve at an impressive pace. Given the prospects in the natural gas fueling market and Clean Energy’s own investments, there is a good probability that the company will be able to make a comeback in the future.

How I Earned 17% Compound Annual Return For 6 Years

Summary Using a carefully crafted portfolio of 18 stocks, I have beat the S&P 500 for the past six years. My portfolio consists of Consumer Stocks, Utilities and Railroads. I buy stocks in small increments on pullbacks to reduce risk and increase profit. Using a carefully crafted portfolio of 18 stocks, I have achieved 17.17% compound annual return since Jan. 1, 2009. I have been investing money for 21 years, and achieved my best years from 2009 to 2014. This article will discuss why I purchased these stocks and my outlook for 2015. My strategy is first and foremost not to lose money. Cash is king. Much of the gains in recent years were from decisions that I made five and 10 years ago. I invested in consumer, utility and railroad stocks that have durability, decent profit margins and a solid future. Over the years, I tended to sell the losers and buy more of the winners. Own the best and sell the rest. Nearly all my gains were from stocks. I only added bonds to the portfolio in early 2014. My brokerage accounts at Charles Schwab have achieved 17.17% compound annual returns from Jan. 1, 2009, to Dec. 24, 2014, compared with 14.41% compound annual return for the S&P 500 over the same time period. If you look at the this chart on my personal blog, you will see my portfolio risk and return are better than a typical aggressive portfolio. Schwab says the risk or standard deviation for an Aggressive Portfolio is 15.40 and the return 15.07. My risk was lower at 11.79, and my 17.17% return was 2.1% better than an Aggressive Portfolio. Below are the securities in our largest brokerage account, which was up 17% in 2014. Name Purchase Price Price on Dec. 28, 2014 % of Portfolio My % Return YTD Return to 12/28/14 Berkshire Hathaway (NYSE: BRK.B ) 117.43 151.35 12.63 28.88% 27.66 Boston Beer Co. (NYSE: SAM ) 218.67 295.74 10.86 35.25 22.31 Canadian National Railway (NYSE: CNI ) 57.32 68.69 1.15 19.84 20.47 Church & Dwight (NYSE: CHD ) 62.14 80.18 6.96 29.03 20.97 Coca Cola (NYSE: KO ) 28.31 42.96 2.72 51.77 3.99 Colgate-Palmolive (NYSE: CL ) 63.90 70.88 0.3 10.93 8.69 ConAgra Foods (NYSE: CAG ) 23.80 36.86 0.26 54.86 9.38 Dominion Resources (NYSE: D ) 58.17 79.28 4.23 36.29 22.56 DuPont (NYSE: DD ) 45.51 75.13 0.21 65.08 15.64 Hershey (NYSE: HSY ) 97.91 106.41 1.78 8.69 9.44 JM Smucker (NYSE: SJM ) 83.77 103.39 0.86 23.41 -0.22 Johnson & Johnson (NYSE: JNJ ) 66.45 105.06 1.31 58.11 14.71 McDonalds (NYSE: MCD ) 75.50 94.78 0.24 25.54 -2.32 Norfolk Southern (NYSE: NSC ) 94.62 111.54 0.28 17.88 20.16 PepsiCo (NYSE: PEP ) 78.70 97.05 2.27 23.32 17.01 Reynolds American (NYSE: RAI ) 37.28 65.71 0.38 76.27 31.45 Union Pacific (NYSE: UNP ) 78.71 120.39 32.14 52.96 43.32 Westar Energy (NYSE: WR ) 36.10 41.87 0.7 15.98 30.15 Burlington Northern Santa Fe 3.05% Due 03/15/22 0.97 100.6348 4.2 3.35 + 3.05% coupon =6.4% N/A Burlington Northern Santa Fe 3.05% Due 09/01/22 0.99 99.9219 4.17 1.90+3.05% coupon = 4.95% N/A Union Pacific 2.75% Due 04/15/23 0.95 98.6744 4.12 4.27+2.75% coupon=7% N/A Union Pacific 2.95% Due 01/15/23 0.96 100.3483 4.19 4.32+2.95% Coupon = 7.27% N/A Cash 1.00 1.00 4.04 You can see that 16.67% of the portfolio is invested in railroad bonds. I bought my Investment Grade bonds on Feb. 3, 2014. U.S. interest rates actually fell in 2014, so my bonds appreciated. My total return on my bonds in 2014 — appreciation plus coupon — was 6.4%. Going forward, I believe my bonds will lose value, because I expect interest rates to rise in 2015. However, I am prepared for these bonds to lose up to 10%, even 20% of market value. I like the income. I plan to hold the bonds to term, so I will not lose anything. From the chart, you can see that my largest holding is Union Pacific ( UNP ) at 32.14% of my portfolio. There is some risk involved with owning so much stock in one company, but the outlook for Union Pacific, and railroads in general, is outstanding. Until that changes, I plan to hold my railroad stocks. When I was a reporter working for a local newspaper, a banker used to come up to me at public meetings and ask me to bring my car loans to him. I would always tell him that I have no car loans, my cars are paid off. One day, he came up to me at a black tie event where he interrupted me while I was talking with some friends. Like an aggressive car salesman, the banker said, “Hey Mike we just dropped our interest rates on home loans. Why don’t you bring your home loan to my bank?” I became incensed. I said, “Mr. Banker my house is paid off. I don’t have any debt. I would be happy to lend you some money if you need it.” He sheepishly walked away and never came up to me again asking for my business. The above story illustrates a point. Bankers are eager to lend money. Many people accept the easy credit and never get out of debt. They don’t benefit from America’s pro-capitalist system that favors ownership of property and businesses. If you want to get ahead in life, stop working for bankers. Make them work for you. Pay off your debts, put your money in the bank and earn interest. Become a capitalist. Own property that appreciates in value. Buy stock in companies that are going to benefit from consumers’ daily spending habits. I own several consumer stocks. My favorite is Church & Dwight ( CHD ), a consumer household products company that owns Arm & Hammer Baking Soda and Trojan condoms — stuff people need regardless of the economy. I also own Colgate-Palmolive ( CL ) , seller of pet food and toothpaste, and Reynolds American ( RAI ), a tobacco company with a history of increasing dividends. I own no biotech stocks. In 2008, I lost about 7% of my investment in Dendreon ( OTCPK:DNDNQ ) after holding it for about four months. I sold it. I also lost money on a pain management company. After these mistakes, I vowed to stay away from biotech and most health care stocks. I own Johnson & Johnson ( JNJ ) because it is so diversified, owning a lot of personal care products as well as medical supplies. I own no mutual funds in our brokerage account. I don’t want to give money to mutual fund managers, who take 1% or even 2% management fees. Cut out the management fees, and there is more money available to invest and compound over time. We own some Vanguard 500 Index Fund (MUTF: VFINX ) in an individual retirement account. Money managers have a tough time trying to beat the Index, so why not just own the index? I buy stock in increments on pullbacks to reduce risk and increase profitability. This really paid off in buying stock in Boston Beer ( SAM ), another great consumer stock. I bought SAM shares in the first nine months of 2014 at an average price of $218; the stock recently hit $288 per share, a 32% gain. My stocks and bonds provide steady income. I do not participate in dividend reinvestment plans. Cash dividends go into my accounts, where they sit in a money market fund until I can find the next deal. I have some regrets. I bought Apple (NASDAQ: AAPL ) at $14 per share in 2000 when it had $12 per share in cash. I sold it at $18 per share when iTunes was introduced. That was a huge mistake. Part of the reason I sold it was to get out of tech and stay focused on my consumer stocks, utilities and railroad stocks. Money managers can find much to criticize with my account. I have too much exposure to railroads. However, I have written about railroads for 20 years. I understand their business models. I believe there is a renaissance taking place in rail today. Railroads are four times more efficient than trucking, especially over long distances. In 2014, railroads experienced their best year since 2007. Conclusion My portfolio is not for everybody. I can handle the risk associated with my overweight positions. I expect 2015 to be a tough year to make money. If low oil prices drag down other asset classes, we could see a bear market. However, consumers are loving the 30% gas price cut. The extra money saved at the pump will likely not sit idly in their bank accounts. I expect consumers to spend more money in 2015 than they did in 2014. The U.S. economy is growing, and this bodes well for the stock market. I am prepared for a 10%, or even 20% correction. If that happens, I will not sell stocks, I will look for opportunities to buy quality assets on the cheap. Editor’s Note: This article covers one or more stocks trading at less than $1 per share and/or with less than a $100 million market cap. Please be aware of the risks associated with these stocks.