Tag Archives: alternative

2015 Could Be A Good Year For Europe ETFs

European equities could outperform in 2015. However, potential investors should hedge currency risk with Eurozone hedged-equity ETFs. Region outlook and focus on hedged-equity ETFs. European equities and related exchange traded funds could outperform in 2015, capitalizing on lower energy prices, an improved export outlook and potentially more European Central Bank easing. For instance, the iShares MSCI EMU ETF (NYSEARCA: EZU ) and the SPDR EURO STOXX 50 (NYSEARCA: FEZ ) both focus on Eurozone countries. Alternatively, investors seeking to capture Eurzone market exposure can also consider a hedged-equity ETF that will help diminish the negative effects of a depreciating euro currency. For example, the Deutsche X-Trackers MSCI Europe Hedged Equity ETF (NYSEARCA: DBEU ), iShares Currency Hedged MSCI EMU ETF (NYSEARCA: HEZU ) and WisdomTree Europe Hedged Equity Fund (NYSEARCA: HEDJ ) hedge against the euro currency and would outperform a non-hedged Europe equity ETF if the euro currency continues to depreciate. DBEU, though, takes a slightly broader approach to the European markets, including about a 40% combined tilt toward the United Kingdom and Switzerland. HEZU and HEDJ only cover Eurozone member states. Wall Street analysts believe that European equities could be one of the best places to invest in 2015, reports Sara Sjolin for MarketWatch . “Europe was a market ‘darling’ this time last year, then became a pariah,” economists at Morgan Stanley said in a research note. “[Now] we like European equities, (especially cyclicals) and European ABS.” Mislav Matejka, chief European equity strategist at J.P. Morgan, even predicts that Eurozone stocks could outperform U.S. equities next year. Specifically, the investment banks are pointing to three factors that will support the region: the ECB, a cheap euro currency and low oil prices. ECB President Mario Draghi has hinted that the central bank could introduce further stimulus in early 2015 and even enact a bond purchasing program. “The mantra is ‘Don’t fight the ECB’ – the central bank is set to inject €1,000 billion and to add sovereign bonds to its buying program,” analysts at Société Générale said in a research note. While the euro currency has depreciated 10% against the U.S. dollar so far, analysts believe there is more room to fall after the ECB enacts further easing. Consequently, the weak euro will help bolster the Eurozone’s large exporting industry, making goods cheaper for foreign buyers. Morgan Stanley predicts the cheap currency could add at least 2% to earnings per share for European companies next year. Lastly, lower energy prices will have an immediate effect on consumers, allowing Europeans to spread around their cash for discretionary purchases and spur growth. Additionally, the cheap oil will lower input costs for companies’ profit margins and lift earnings. Furthermore, analysts believe that if the ECB begins a quantitative easing plan, the financial sector will be a key beneficiary. Most major Eurozone banks are already in good shape and should capitalize on improved credit supply and loan demand. For targeted Europe financial exposure, investors can take a look at the iShares MSCI Europe Financials ETF (NASDAQ: EUFN ) . However, the ETF does not hedge against currency risks. Max Chen contributed to this article .

Pioneer High Income Trust’s 45% Premium Looks Ripe For Contraction In 2015

Summary PHT’s 45% premium is three standard deviations above its 1-year average premium. NAV performance has struggled this year, while the market price has increased 12%. 20% of PHT’s portfolio is invested in energy-related securities, increasing the portfolio’s risk. Overview: The Pioneer High Income Trust (NYSE: PHT ) is a high yield bond closed-end fund with a solid track record and a strong management team. High yield funds have struggled recently, as slumping oil prices have raised concerns that highly levered energy companies could default on their debt. Energy companies have been some of the largest issuers of high yield debt in recent years. Expectations of rising interest rates in 2015 have also pressured the high yield market. PHT’s strong performance and high yield have caused shares to trade at a persistent premium since 2009. The fund has a five-year average premium of 23.53%. Recently, the premium has expanded. PHT’s price performance has remained strong, while the underlying NAV performance has struggled along with its high yield peers. The premium has increased to 45.54%. This premium is near the highest ever for this fund and looks vulnerable to a pullback. Key Investment Highlights: High Premium: PHT is currently trading at a 45.54% premium to NAV. This is significantly higher than its 1-year average premium of 29.05% and its 5-year average premium of 23.53%. Evidence of the wider than normal discount, the Z-Statistic of 3.20 shows the current premium is trading more than 3 standard deviations wider than normal. High Yield Performance: Spreads on high yield bonds have contracted as the Fed’s zero interest rate policy has driven investors to reach for yield. Spreads have started to widen as investors contemplate higher interest rates and the potential for increased defaults. These factors have pressured the returns of high yield bonds. PHT’s premium has grown during the years since the financial crisis, driven by consistent strong returns. If returns from high yields are pressured, it is likely PHT’s premium will be pressured as well. Energy Exposure: PHT has significant exposure to energy-related high yield bonds in its portfolio. As of 9/30/2014, 20.02% of the portfolio is invested in energy related holdings. For comparison, the iShares iBoxx High Yield Corporate Bond ETF (NYSEARCA: HYG ) currently has 13.47% of its assets invested in the energy sector. If energy prices remain compressed, PHT’s performance may suffer. Key Investment Risks: Continued Economic Recovery: High yield bonds tend to have strong performance during economic recoveries due to lower default risk. If the economy continues to chug along, high yield bonds may show strong performance, allowing PHT to continue to trade at a significant premium. Energy Price Recovery: A recovery in energy prices would relieve concerns of energy company defaults, allowing energy-related bond prices to recover. Due to PHT’s exposure to energy-related issues a recovery in energy prices would benefit PHT’s NAV performance. Key Portfolio Metrics: Premium/Discount: 45.54% Z-Statistic 3.20 Market Distribution Rate: 9.46% Current Monthly Distribution: $0.1375 Average Earnings/Share: $0.1200 Average Earnings/Distribution: 87.27% UNII Per Share: $0.2238 Effective Leverage: 30.42% Effective Duration: 3.06 Performance: Using ETFs with a similar investment objective can give a good comparison to evaluate management’s performance. HYG is a widely used high yield bond ETF that offers a good comparison for PHT. PHT has a long track record and compares favorably to HYG over the 3- and 5-year periods based on both price and NAV performance. The 10-year track record of 10% per year is attractive and shows the strength of this fund. However, PHT has underperformed over recent time periods likely due to the fund’s riskier holdings and higher energy exposure. The recent divergence between NAV and market performance is what has driven the premium. Data as of 12/26/2014 Source: Morningstar Premium/Discount: (click to enlarge) Source: CEFConnect The fund closed 12/26/2014 at a 45.54% premium to the NAV, or underlying value of the portfolio. This is above the 52-week average premium of 29.05%. The recent divergence between NAV performance and market performance has driven the premium higher. PHT has a strong performance track record that has caused the fund to trade at a persistent premium since 2009. However, the current premium is very high for this fund and investors may want to look elsewhere for their high yield exposure at least until the premium drops down below historical levels. Expense Ratio: PHT pays 0.60% of daily managed assets to Pioneer Investment Management for investment management. The annual expense ratio for PHT as of 3/31/2014 was 1.04. This is a relatively low fee for a high yield closed-end fund. The fee is particularly attractive when considering the strong work that management has done over time. Distribution: PHT pays a monthly distribution of $0.1375/share. The distribution equates to an annual distribution yield of 9.46% based on current market prices and 13.77% based on NAV. PHT’s earnings only cover 87% of the distribution. The fund does have $0.2238 in UNII so the distribution shouldn’t be at risk for a while. If interest rates remain low, PHT may have to reduce its distribution in the future. Leverage: PHT employs leverage through a margin account with Credit Suisse. The fund borrows at three-month LIBOR plus 0.70%. This is a relatively low cost form of leverage in the current market. This does cause concern over the long-term cost of leverage. If interest rates rise, it could increase the cost of leverage to the fund since PHT doesn’t have fixed cost leverage in place. Liquidity: PHT is a moderately sized CEF with $496.37 million in net assets. PHT has 80,000 shares traded on average a day. This represents $1.4 million in daily volume at current prices. This is reasonable liquidity for a CEF and should allow investors to fill orders without problems. It is always wise to use limit orders to purchase or sell shares of closed-end funds, as the bid/ask spread can be wide. Management: PHT is managed by Pioneer Investment Management, a wholly owned subsidiary of UniCredit S.p.A. Pioneer is a well respected fund family with significant fixed income resources and a long track record. The fund appears to be in good hands. Portfolio: Geographic Allocation Source: Pioneer as of 11/30/2014 Most of PHT’s portfolio is based in the United States. PHT has assets invested in several other countries, but none of these countries make up more than 5% of assets. Sector Allocation Source: Pioneer as of 11/30/2014 PHT has broad sector exposure, but the majority of the portfolio is invested in U.S. high yield corporate bonds. One area to watch is the exposure to event-linked bonds. Many of the event-linked bonds in the portfolio are catastrophe bonds. Several of Pioneer’s other funds have significant exposure to catastrophe bonds. These bonds can offer non-correlated high yields, but investors should be conscious of the risks of investing in these bonds. Of particular interest is their non-correlation with high yield bonds. The exposure to catastrophe bonds isn’t high enough to cause concern here, but should be watched to make sure it doesn’t increase over an individual’s risk tolerance. Credit Ratings Source: Pioneer as of 11/30/2014 As would be expected, PHT is mostly invested in high yield bonds. The fund is on the riskier side with 28% of the portfolio invested in CCC rated bonds. Maturity Breakdown Source: Pioneer as of 11/30/2014 The portfolio is invested in relatively short-term bonds. Only 5.7% of the portfolio matures beyond 10 years. The short maturity should help reduce portfolio volatility. However, short maturities increase the risk that yields will not be maintained when proceeds from maturing securities are reinvested. Source: Pioneer as of 11/30/2014 PHT has a diverse portfolio with 363 different securities. The top ten holdings represent only 9.50% of the total portfolio. The portfolio turnover has been low. PHT had a 16% turnover as of 9/30/2014. The highest portfolio turnover in the past five years was 30%. Strategy: PHT’s primary investment objective is to seek high current income with a secondary objective to seek capital appreciation. The fund is able to invest up to 50% of the assets in illiquid securities. The fund is also able to invest in securities of issuers that are in default or that are in bankruptcy. Tax Issues: As of September 30, 2014, the fund had $12,223,142 of net unrealized appreciation in the portfolio. These gains are offset by $46,261,236 in capital loss carryforwards. Conclusion: PHT is a strong fund with capable management. However, the current premium to NAV reduces the attractiveness of the investment at this point. Additionally, portfolio risks don’t appear to be accounted for in the market price. Higher interest rates could pressure high yield returns. The fund’s high exposure to energy related holdings could hurt performance if oil prices remain depressed. If negative NAV performance continues, the fund’s premium would likely erode. This is a fund that I would avoid until there is a significant reduction in the premium.

Opportunities In Russia?

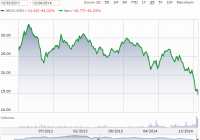
Russian companies may offer the best values in the world currently. Buying assets for pennies on the dollar. An excellent contrarian play is developing. “After an extremely strong performance by U.S. markets this year, it is our belief that emerging markets will be more in focus next year as investors rotate into underperforming areas. Of these markets, Russia, has the lowest fundamental valuation. With new positive light shining on President Vladimir Putin, after having negotiated a peaceful solution to Syria’s chemical weapons program, and the world watching the 2014 Winter Olympics in Sochi, Russia; we expect the government controls to loosen providing an economic boost on top of a general recovery in equity prices.” That was an excerpt taken from a letter I wrote to clients in November of last year, 2013. My timing was nearly perfect in choosing the precise opposite moment to go long Russian equities. The comments occurred at what would prove to be the high-water mark for the Russian equity markets to date. What seemed like unrelated developments in neighboring Ukraine would prove to be a harbinger for things to come. In December 2013 more than 800,000 protesters occupied Ukraine’s Kiev city hall and Independence Square in Ukraine. And by February 22nd, after months of violence and the resignation of Ukrainian Prime Minister Mykola Azarov, the government collapsed as protesters took control of presidential administrative buildings and President Yanukovych fled the country. Less than a week later “pro-Russian” gunmen responded to the collapse of the regime by seizing key buildings in the Crimean capital, Simferopol. On March 16th, Crimea seceded from Ukraine and two days later Russian President Vladimir Putin signed a bill absorbing Crimea into Russia. Since Crimea’s annexation, violent clashes between the new Ukrainian government and pro-Russian militants have continued along the Russian-Ukrainian border. Tensions between the European Union, along with the U.S., and Russia continued to mount as violence escalated. On July 30, 2014 the EU and U.S., along with other NATO nations, announced sanctions against Russia. Little progress toward a peaceful outcome has been made in the months since. The sanctions imposed in July were directed at Russia’s economy. Specifically against the financial sector and the majority government-owned Russian banks. Additional trade restrictions were aimed at the energy and defense industries along with individuals and entities whose overseas assets were frozen. Sanctions have continued to strengthen and have been adopted by additional countries around the world putting a severe strain on the Russian economy. Even before the sanctions, Russia’s perceived involvement in the fighting had already taken a toll on Russian equities as their markets fell by 25% by the spring of 2014, as seen here by the Market Vectors Russia ETF (NYSEARCA: RSX ): By autumn, the Russian real economy was showing the strains from the bite of sanctions. As if things could not have been getting any worse for Russian markets the price of oil had also begun a precipitous fall in June of this year and has not yet stopped even with the price of crude having been cut in half. While prices seem to have stabilized in the past couple of weeks it is still unclear as to whether or not that massive fall is now over or if we might still see more downside pressure. Just over half of Russia’s stock market capitalization is made up of oil and gas producers. As is always the case, oil producers have fallen in tandem with Brent Crude prices helping to push the overall Russian markets down an impressive 47% this year, making it the worst performer anywhere in 2014. As a result of oil’s depreciated price and the sanctions against their financial industry, the Russian Ruble has collapsed 70% against the U.S dollar putting even further pressure on the economy as the price of necessary imports become unaffordable. All of the above factors have pushed Russia into what is expected to be a deep recession next year. Data released by the Economy Ministry of Russia on December 29th showed the country’s GDP shrinking 0.5% in November. This was the first contraction since September 2009 during the global financial crisis and follows forecasts for GDP to fall as much as 4.7% in 2015 if oil prices remain at current levels. So the question now is whether or not all of this bad news has been priced into an already fundamentally ‘cheap’ market? Over the past 10 years Russian shares have traded at a discount to other emerging markets with an average Price-to-Earnings (P/E) ratio of 7.1. This discount reflects the country’s political risks as well as its dependence on the cyclical energy industry. While a discount is deserved, current valuations are reaching levels of absurdity. The U.S. based ETF RSX, whose stated goal is to “replicate as closely as possible, before fees and expenses, the price and yield performance of the Market Vectors Russia Index”, is the simplest way for U.S. investors to gain exposure to the overall Russian market. Currently the companies owned in the ETF portfolio have an average P/E of 6.55 and a Price-to-Book (P/B) ratio of 1.08. While certainly a discount to the country’s long term average it doesn’t exactly scream “bargain” at those valuations. A closer look at individual companies however yields a much different picture. Gazprom ( OTCQX:GZPFY ), the country’s largest company by market cap, currently trades at a P/E of 1.66 with a (P/B) ratio at 0.18. Sberbank ( OTCPK:SBRCY ), the country’s largest bank, trades at a P/E of 1.91 with a P/B at 0.35. OAO Tatneft ( OTCPK:OAOFY ), an oil and gas exploration company, trades at a P/E of 3.21 and P/B at 0.53 All of these companies are directly impacted by current and potential future sanctions, low oil prices, and the overall economic decline. They deserve to be trading at discounts to their foreign peers and historical averages. However, current valuations for these companies are absurdly low considering that they do have real value in their owned assets and their potential future earnings. When you can purchase $1.00 worth of assets for $0.18, as is the case with Gazprom based on their P/B ratio, or $0.35 and $0.53 on the dollar with Sberbenk and Tatneft respectively; I believe it to be a worthwhile endeavor to take a closer look at the potential opportunity. It is unlikely that all-out war will break out between NATO and Russia, as it would benefit no one. I also find it more likely that sanctions will begin to ease rather than tighten as the European Union is suffering economically from the imposed sanctions as well. It looks more and more likely that the EU will also fall into recession next year and I would expect them to start pushing back against any further sanctions suggested by the U.S. in an attempt to restore their own economies. It’s also important to remember that Europe is highly dependent on Russian energy exports for their own well-being and while finding replacement sources is not impossible it is substantially more expensive. While market participants’ sentiments may not have reached the point of maximum pessimism, and additional problems can certainly arise; at some point this market will bottom. Russia will continue to not only exist in the future but grow economically. An excellent contrarian play is developing. I wouldn’t attempt to call a bottom at current levels but when the situation does begin to improve, either through conciliatory actions by the Russian government leading to easing of sanctions or a price recovery in oil, or both, the market upside could be substantial for the brave few who take advantage at the right time.