In Search Of Income: Covered Call CEFs (Part I – Sector Analysis)
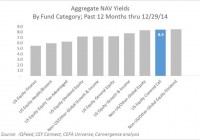
Summary Covered call closed-end funds are popular among CEF investors for their ability to generate significant and relatively consistent income with reduced equity market risk. However, the sector has lagged other equity CEF types in the past year and is currently out of favor. Discounts widened significantly in December to about 8% (in aggregate), making this an attractive time to establish a position in covered call CEFs. Covered Call CEFs are the largest and most popular segment of equity CEFs because of their ability to generate income in a risk-managed way. This article will provide a high-level overview of the strategy employed by these funds, as well as its potential rewards and risks to help you decide whether the sector is well suited to your objectives. Our follow-up article will recommend several especially attractive CEFs within this category for income-seeking investors to consider. Universe of Included Funds The Convergence investing universe consists of more than 475 closed-end funds across all available equity and bond sectors, after filtering for funds that we consider not investable for a variety of reasons (the most common being size/liquidity, NAV transparency) The Covered Call Fund segment consists of the following closed-end funds: BlackRock Enhanced Equity Dividend Trust (NYSE: BDJ ) BlackRock International Growth & Income Trust (NYSE: BGY ) BlackRock Global Opportunities Equity Trust (NYSE: BOE ) BlackRock Enhanced Capital & Income Fund (NYSE: CII ) Eaton Vance Enhanced Equity Income Fund (NYSE: EOI ) Eaton Vance Enhanced Equity Income Fund II (NYSE: EOS ) Eaton Vance Risk-Managed Diversified Equity Income Fund (NYSE: ETJ ) Eaton Vance Tax-Managed Buy-Write Opportunities Fund (NYSE: ETV ) Eaton Vance Tax-Managed Global Buy-Write Opportunities Fund (NYSE: ETW ) Eaton Vance Tax-Managed Diversified Equity Income Fund (NYSE: ETY ) Eaton Vance Tax-Managed Global Diversified Equity Income Fund (NYSE: EXG ) First Trust Enhanced Equity Income Fund (NYSE: FFA ) GAMCO Natural Resources Gold & Income Trust (NYSE: GNT ) Guggenheim Enhanced Equity Income Fund (NYSE: GPM ) ING Global Advantage & Premium Opportunity Fund (NYSE: IGA ) ING Global Equity Dividend & Premium Opportunity Fund (NYSE: IGD ) Cohen & Steers Global Income Builder (NYSE: INB ) Voya Natural Resources Equity Income Fund (NYSE: IRR ) Madison Covered Call & Equity Strategy Fund (NYSE: MCN ) Madison Strategic Sector Premium Fund (NYSE: MSP ) NFJ Dividend&Premium Strategy Fund (NYSE: NFJ ) Columbia Seligman Premium Technology Growth Fund (NYSE: STK ) Understanding Covered Call Closed-End Funds Covered Call Funds, also commonly known as “buy-write funds”, unsurprisingly are funds that employ covered call strategies, which combine two elements: A long position in a portfolios of equities – either diversified or concentrated – which the fund manager believes will maintain or increase value A short position in call options (i.e., written options) on either individual equities or indices that are identical or similar to those held within a portfolio Because the call options are sold against identical or similar positions to those in the portfolio, they are considered “covered” by held assets, thereby neutralizing the risk normally associated with writing options. Covered call option sellers fare best when markets are trading in a narrow range. That is because the option seller relinquishes the upside potential (in excess of the strike price) in exchange for the revenue earned on the sale of the option. The missed upside opportunity in a strong bull market is given up by virtue of the existence of the outstanding option which will of certain be exercised in the event that the optioned stock is trading at a price in excess of the strike price. On the other hand, the premium on the option is a hedge against the decline in the market value of the underlying stock. The most profitable situation is where the stock price is at of just below the strike price at the time of expiration of the option. Most commonly, covered call funds will write near term (1 to 3 months to expiry) options that are slightly (1-5%) out of the money on a few representative equity indices rather than dozens of individual equities on only part of their equity portfolio, though each fund differs. It is rare that covered call CEFs apply leverage to further enhance returns. Return of Capital in Covered Call Funds Commonly, investors early in their closed-end funds discovery process will learn about the concept “return of capital” or ROC. Most often, investors (incorrectly) simplify their interpretation of ROC as an always negative red flag and staunchly avoid funds that characterize any significant part of distributions as ROC. Like most simplifications, this omits several important nuances about ROC as related to covered call funds. According to GAAP accounting principles, premiums received for writing of options cannot be booked as income until the call is (A) sold or ((NYSE: B )) settled. Further, most covered call strategies use index options (e.g., on S&P 500 futures) that are cash-settled at expiry (i.e., don’t lead to stocks being called away). During rising markets, covered call funds often generate realized losses on options and typically larger unrealized gains on the equity portfolio. As a result, funds are often required to characterize distribution of income generated from the call writing activities as ROC even when the value of the fund is increasing. Investors actually benefit from this sort of ROC because distributions characterized as ROC allow investors to delay taxes (ROC will reduce cost basis and therefore will lead to larger capital gains payments when the CEF position is sold from your account). We believe that a better measure to evaluate the performance of a fund is the increase or decrease of NAV adjusted by the distributions paid for the accounting period. As long as the fund is generating an attractive total return (comprised of NAV increases and distributions paid), ROC is not something to be feared in covered call funds. Potential Advantages of Covered Call Closed-End Funds Investors attracted to covered call CEFs may be considering alternatives in the ETF or mutual fund space. Key reasons why investors choose covered call strategies in general and closed-end fund vehicles in particular include: Enhanced Yield – The core reason why covered call strategies have found so much popularity in the realm of closed-end funds is that they offer an elegant method of generating a steady, supercharged income stream from equities without selling positions. This, of course, does not come without a price (potential capital gains) but is a prized attribute of these funds to their intended audience. Diversification – As with any CEF, a key attraction to potential investors is the ability to gain exposure to many dozens or hundreds of holdings within a single fund. This offers an efficient path to the benefits of diversification. Simplicity – Using a closed-end fund (or ETF or mutual fund, for that matter) which executes a buy-write strategy frees the individual investor from the sometimes cumbersome task of managing option portfolios, closing positions before expiry, etc. Discount Opportunities – Because closed-end funds can, and typically do, trade at a meaningful discount to the NAV , CEF investors achieve yields higher than if he or she were to invest directly in the same set of securities. CEF Covered Call funds offer discounts to NAV that vary from nearly zero to double digit percentages. There is almost no correlation between the amount of distributions and the discount to the NAV of the fund’s holdings. Thus, other factors play a part in evaluating the suitability of individual funds as will be discussed below in this article and in Part II recommendations of specific investments. A Framework for Evaluating the Sector There are many qualitative and quantitative factors that prospective investors can consider when evaluating a closed-end fund. Convergence Investments summarizes these many factors into six dimensions useful for comparing and choosing investments: Distribution Yield – How much – and what type(s) – of distribution (aka “yield”) does the fund offer? How likely is it that the fund can maintain or increase this distribution in future? NAV Performance – How has a sector’s or individual fund’s NAV changed in the recent past? What is the outlook for future NAV trends? Valuation – Where is the current market price relative to current NAV for a fund or sector? How does this premium (or discount) to NAV compare to the past and to other fund categories? Risk – What level and type of risk is an investor bearing to earn distributions and potential capital gains? Stewardship – Does a fund have strong management? Are its management fees reasonable? Does the board have shareholder-friendly policies in place? Tradeability – How readily can we take a position (long or short) in a particular fund? What are the liquidity (market cap, average daily volume) and trading costs (average spreads, short borrow fees) involved? Distribution Yield Hefty distribution yields are among the top motivators for closed-end fund investors. While there are many nuances to fund distributions, including how they’re generated and how sustainable they appear to be, the top-line yield number drives much of the sentiment and investor behavior. In aggregate, funds in the covered call segment are at the top end of the range of equity funds with an 8.5% annualized distribution on a NAV basis. Note: all distribution yields are shown as a percentage of NAV rather than market price to provide a more accurate measure of the income generated from portfolio assets. Investors holding closed-end funds at a discount to NAV will earn yields greater than the NAV yields shown below. (click to enlarge) NAV Performance Investors disagree about how to interpret recent increases in net asset value. Momentum-oriented investors may see this as a trend likely to continue, while mean reversion investors may see exactly the opposite. As a group, covered call funds have significantly lagged other types of equity closed-end funds, with approximately flat NAV returns through 2014. We view this weakness as a moderate negative because falling NAV does create risk for cuts to distribution policy and can sour investor sentiment. However, we also believe that much of this weakness has already been priced into covered call funds in the form of market discounts to NAV. (click to enlarge) Valuation A major reason to invest in closed-end funds rather than ETFs or traditional mutual funds is the possibility for informed investors to take advantage of the disconnect between fund price and fund NAV, often referred to as the fund’s premium or discount. We seek to purchase funds at sizeable discounts, and ideally at discounts beyond that which is normal relative to history and/or relative to a fund’s peers in category. Purchasing at a discount offers two attractions. First, purchasing at a discount enhances yields since an investor can own the rights to the income generated from a hypothetical $10 of net assets with only $9 of investment. Second, for investors willing to actively manage their holdings, funds purchased at particularly wide discounts can be sold at narrower discounts – or even premiums – for capital gains that enhance the total returns from a fund. Covered call funds are currently trading at about a 7% discount to NAV, in aggregate, which falls in the middle of recent historical ranges. It’s worth noting, however, that this discount has widened from 5% in the past month. We believe this widening of discounts has created a near-term buying opportunity for potential investors that are attracted to the category’s fundamentals. (click to enlarge) Note: Convergence follows the convention of representing all premiums (price > NAV) as a positive number and all discounts (price < NAV) as a negative value. Risk There are no investment free lunches. Covered call CEFs offer high single digit or even double digit yields to investors as compensation for the various risks that investors are being asked to take. As with "plain vanilla" equity funds, investors of this fund type are primarily being paid to take equity market risk (i.e., beta risk). However, one benefit of a covered call strategy is that exposure to market risk is lessened because the premiums received for call writing can cushion or offset downward swings in the value of an equity portfolio. Covered call CEFs have had a "beta" of about 0.79 vs. the S&P 500 as compared to a beta of 1.05 for "General Equity" closed-end funds - though please note that wide variation exists within every category. Stay tuned for Part 2 where we will drill into specific low-beta covered call funds. (click to enlarge) Liquidity Shorter term and larger investors give a lot of attention to liquidity of an investment, meaning the ability to quickly and efficiently enter or exit a specific position at in sufficient quantity (for them). Longer-term and smaller investors pay little attention to this aspect because they perceive that they will not require large, rapid trading into or out of a position. Covered call CEFs are among the most liquid of all CEF categories, with almost $50M per day traded (click to enlarge) Conclusion The Covered Call Closed-End Fund sector can be an attractive investment option to investors seeking significant and relatively consistent income within the typically volatile equity markets. While investors in covered call CEFs must recognize that they are partially sacrificing their claim to potential upside returns from a continued bull market, those viewing current markets as fully valued may appreciate the ability of covered call funds to generate income without rising market levels. Closed-end fund investors seemed to have soured on covered call funds in December 2014, leading to several attractively priced investments in the group. Stay tuned for the second part of this article with an in-depth profiling of top funds within this category. Additional disclosure: Convergence Investment Management may recommend various securities included within this article for inclusion for individual client portfolios. These recommendations may change at any time and are specific to the individual client's objectives and risk tolerance.