Tag Archives: alternative

GAMCO Natural Resources, Gold & Income Trust: Similar But Different Discounted CEF Opportunity

Summary GNT invests in hard assets and trades at a discount to NAV, like its sibling GGN. GNT, however, has a more diversified portfolio and doesn’t use leverage. Although GNT has a lower yield than GGN, it may be a better option for some investors. GAMCO Natural Resources, Gold & Income Trust (NYSE: GNT ) is a sister fund to GAMCO Global Gold, Natural Resources & Income Trust (NYSEMKT: GGN ), another closed-end fund, or CEF, that I recently wrote about . GNT shares many similarities with its older sibling, but the differences could make it more appropriate for some investors looking for a combination of hard asset exposure, income, and “outsourcing.” The same but different Like GGN, GNT is heavily invested in the precious metals, mining, energy, and energy services sectors (this quartet makes up around 80% of its portfolio). That fits tightly with its name and is roughly similar to GGN’s allocation. GNT, however, has more leeway in its security selection, putting another 15% of assets in the specialty chemicals, agriculture, and machinery sectors. This is likely the reason for the very slight difference in the naming of these two closed-end funds. (Note the switched places of natural resources and gold in the two names.) What it means for investors is that GNT is a bit more diversified. That can be a good thing on one hand, but also tells you that this CEF isn’t a pure play precious metals and energy fund. If that’s what you are looking for, you’re better off with GGN or some other option. Another big difference between the two is the use of leverage. GGN uses leverage, GNT does not. That could limit performance at GNT in an up market, but won’t exacerbate losses in a down market. And since weak gold prices and recently plummeting oil prices have been a big issue for the fund, that’s not such a bad thing right now. GNT, however, does make use of options, like its sibling, to meet its primary goal of income generation. That’s why income investors should like this CEF and its monthly dividend. Currently it’s paying $0.07 a share, a reduction from $0.09 a share paid in December. The yield based on the lowered dividend is a touch over 10%. Although that’s nothing to sneer at, GGN’s yield is closer to 12%. But that higher yield comes with the added risk of leverage and with a less diversified portfolio mandate. A trade off worth spending some time considering. But don’t forget the dividend cut, because such dividend changes are a risk inherent to both CEFs. On sale Last year wasn’t any kinder to GNT than it was to GGN (down nearly 24%), with GNT shares falling around 22% (total return, which includes dividends was a loss of around 13%). That’s largely because commodities of all sorts were out of favor. Gold, for example, has been a laggard for some time and oil’s quick fall is filling the headlines right now. However, such hard assets, including other commodities like food, can be a haven in a storm. Gold, for example, is an inflation hedge and a safety vest when the market gets stormy. It’s why asset allocation models include such securities, they provide diversification. That doesn’t mean load up on either GGN or GNT, but it does mean that adding a little of either to an otherwise diversified portfolio could be a good long-term decision. And now is a good time to consider it if you haven’t already. First off, the fund had a bad year last year because the sectors on which it focuses underperformed. There are various reasons for that, and fear of further downside risk could keep you away, but it also means that these sectors are on sale. If you wanted to own them, but haven’t pulled the trigger, they’re cheap right now. But that’s not the only sale going on. GNT is a closed-end fund, which means its market price often deviates from its net asset value, or NAV. NAV is the actual value of what GNT owns on a per share basis. Over the last couple of years, GNT has traded at a discount to its NAV in late December and early January, with the gap narrowing as the new year progresses. Investors selling shares that have gone down in value to lock in losses for tax purposes is a part of this. The discount is currently nearly 9%, larger than sibling GGN’s 5% or so. And while GNT doesn’t have as long a history, the trends for the two are roughly similar. So you could view GNT as being on double mark down. That allows you to pick up a high yield, the chance for the discount to narrow, and exposure to out of favor hard assets. Very similar to what GGN offers, but without the leverage and with a bit more portfolio level diversification. Author’s Note: The comments on the GGN article referenced above brought up some valid points that will be similar for GNT for long-term investors. They are worth a read if you haven’t seen them. This article, like the one about GGN, speaks more to new investors. I plan to address some of the thoughts presented by long-term investors in a future article. It’s number four or five in the cue of ideas brought out by recent comments on articles I’ve written. And I want to thank those who have respectfully disagreed with me. Respectful discussion makes this community better and more fun.
Motiwala Capital Q4 2014 Letter

Summary 2014 Q4 Letter to investors. Winners and mistakes. Portfolio activity (buys, sells). Fourth Quarter 2014 Letter The year 2014 ended on a strong note with the US equity market as reflected by S&P 500 up ~14% The US markets are in an amazing six year bull market with the S&P 500 having tripled from the lows of March 2009. Motiwala Capital had a below average year with consolidated net return (after all fees and expenses) of ~4%. The consolidated number means some accounts performed below this number and some above it. See important notes at the end of the letter for more information. The performance information is shown in the table below: Year S&P 500 Motiwala Capital 2011* -1.7% 4.9% 2012 16.0% 20.3% 2013 31.9% 33.2% 2014 13.7% 3.9% 2014 Performance Overall our performance in 2014 was poor both on absolute and relative basis. There were more winners than losers but two large positions suffered large declines hurting overall performance. Positions detracting from performance included North Atlantic Drilling (NYSE: NADL ) (-80%), Prosafe ( OTCPK:PRSEY ) (-57%), CTC Media (NASDAQ: CTCM ) (-33%), Blucora (NASDAQ: BCOR ) (-27%) and International Housewares (-22%). Our biggest winners were Microcap H (+90%), Microcap L (+48%), Apple (NASDAQ: AAPL ) (+42%), Visteon (NYSE: VC ) (+40%), Microsoft (NASDAQ: MSFT ) (+25%) and Oracle (NYSE: ORCL ) (+20%). In addition, 14 of the 17 special situation investments during 2014 were profitable (or breakeven) and positively impacted our portfolio returns. We will continue to invest in this area and believe it distinguishes our management style. Discussion on winners Microcaps H and L were purchased at low valuations. Both exhibited strong earnings growth and were rewarded with higher valuations resulting in superb gains. Apple had a fantastic year, releasing exciting new products and continuing to return capital to shareholders via share buybacks and dividends. Investors were more optimistic and the share price headed higher. Visteon continued to divest non-core businesses and investors were happy. Recently, the company announced the sale of its majority stake in publicly traded Halla-Visteon for $3.6 billion. Visteon will be left with only one business segment and could be potentially acquired. Microsoft and Oracle reported business as usual generating solid free cash flow and continued buybacks and dividends. Discussion on mistakes High leverage, capex and high dividend payout The positions in North Atlantic Drilling and Prosafe hurt the portfolio returns by 6%. These were the biggest mistakes since 2011. Both companies are in the energy service industry, cyclical in nature and dependent on capital spending by large oil producers, which in turn depends on crude oil pricing. NADL and PRSEY had significant capital expenditures and high levels of debt. To add fuel to the fire, they had a high (75-100%) dividend payout policy. The combination of these three factors in a cyclical business is too risky. I will guard against this in the future. Prosafe warned about weakening demand and potential dividend cuts in its Q2 earnings. The stock price fell and I felt that the bad news was priced in. In the case of NADL, its agreement with Rosneft ( OTC:RNFTF ) did not close due to sanctions against Russian entities. NADL suspended its dividend given the weak outlook. From mid September, crude oil prices started declining and there was a meltdown in late November. Most energy related stocks including NADL and PRSEY declined sharply as result. When the situation changes I purchased shares of Russian media company CTCM Media in March 2014. My argument then was “CTCM has a solid balance sheet and produces attractive free cash flows. CTCM was purchased for 10%+ FCF yield. When Russia moves out of the front-page news, I hope the stock would be higher.” After purchase, the stock appreciated by 25% despite Russia continuing to be in the headlines. The stock was still cheap and I continued to hold. However, in late September Russia passed a law restricting ownership of Russian media companies to 20% from the prior 50%. This was unexpected and the stock price took a 20% hit. Later the stock was also hurt by the rapid depreciation of the Rubble, which was caused by the rapid decline in crude oil prices. CTCM indirectly became linked to energy prices. My mistake here was not selling immediately after the media law change, which would have reduced our losses. Portfolio Composition Our portfolios are divided into two sections. The ‘Generals’ are generally undervalued equity investments that fit the value framework. The rest of the portfolio is invested in special situations (short term investments with a specific event that unlocks value) or cash. Average cash balance at the end of 2013 was 45%. The top 5 positions add up to 25% of the portfolio. We have 16 regular positions (Generals) in our portfolio. This makes up ~45% of the portfolio. The rest of the portfolio is currently in special situations (10%) and cash (45%). Cash is 30% higher over last quarter end due to heavy selling as explained later. Portfolio Characteristics Weighted average P/E = 12 (P/E is based on 12-month trailing earnings) Portfolio dividend yield = 2.4% Weighted average Market Cap = $55 billion Price to Value (P/V) For every stock we purchase, we estimate a range of fair values. We compute a ratio of current market price (price) to estimated value (value). Price to value on the invested portfolio was 0.83. Lower P/V means better upside and limited downside. A higher P/V points to lower future upside potential for the portfolio. We will continue to look for attractive investments that will help to lower the P/V at the portfolio level. Top 7 Positions (some clients will not have all the positions and in the same weights) Company name (Ticker) % of portfolio B/S Div FCF ROIC Val Visteon (Equity and Warrants) 7.5% Y Y Microcap H 5.6% Y Y Y Y Y Outerwall (NASDAQ: OUTR ) 5.4% Y Y Y Oracle 3.6% Y Y Y Y Y Blucora 3.3% Y Y Y Y Qualcomm (NASDAQ: QCOM ) 3.1% Y Y Y Y Y Conrad Industries ( OTCPK:CNRD ) 3.1% Y Y Y Y Y For the above stocks, we have provided information about which characteristics they satisfy B/S = strong balance sheet Div = pays a dividend FCF = solid free cash flow ROIC = solid Return on Invested Capital (NASDAQ: ROIC ) Val = low/reasonable valuation Portfolio by Market Cap Micro cap 18% less than $250m Small Cap 15% $250m to $2billion Mid Cap 9% $2 billion to $10 billion Large Cap 8% $10 billion to $200 billion Mega Cap 5% $200 billion + We have invested across the market cap spectrum and are market cap agnostic. Portfolio by Sector Sector Weight Technology 12% Consumer Discretionary 12% Financials 7% Energy 6% Telecom 3% Consumer Staples 3% Industrials 1% Special Situations 11% Cash 45% We do not seek investments by sector. We make our investments one stock at a time. However, as part of risk management, we want to make sure that our investments are across multiple sectors. Portfolio Activity Special Situations: Share tenders We participated in two special situations in the quarter that were profitable. Generals: Portfolio exits: We sold out of seven positions in the quarter. Some positions were sold as they hit our price targets, while some were sold when I was concerned about the business or the situation had changed. Microsoft ( MSFT ): We purchased shares of Microsoft in early 2011 around $26. During our 3+ years holding period, Microsoft has continued to be very profitable, generate lot of free cash flow, paid dividends and buyback shares. A new CEO has come in and the market perception has improved. We sold our shares around $46 as the stock price appreciated to our price target. Vodafone (NASDAQ: VOD ): Vodafone shares were also purchased in early 2011. It owned 45% of Verizon wireless back then. After the sale of its stake in Verizon wireless, VOD made some acquisitions in Europe and decided to invest heavily in its network. The major part of its business is in Europe and has been struggling for several years. The negatives from Europe are greater than the positives from the rest of its business in Asia and Africa. Finally, VOD has gone from net cash to net debt on its balance sheet to finance the dividend and capex. These combined factors swayed us to sell the position. Amcon Distributing (NYSEMKT: DIT ): DIT was purchased in the second quarter of 2013. DIT is a wholesale distributor of consumer products to convenience stores. Since our purchase, business results have been soft with declining earnings and ROE on increasing competition. Despite this, the stock price appreciated, seemed fairly valued and we sold. Hess Corp (NYSE: HES ): We sold our remaining shares of HES. HES was purchased as a special situation when it was selling assets, paying down debt and buying back shares. HES has now become a pure play E&P company. I had no interest to own HES beyond the asset sales. I was holding on for the announced spinoff of an MLP. However, with declining crude oil prices, it made sense to close the position. National Oilwell Varco (NYSE: NOV ): NOV was another energy services company in the portfolio. It is a high quality albeit cyclical business with a solid balance sheet and generates good free cash flow. NOV was sold in response to the sharp decline in crude oil prices. A major part of NOV business is providing equipment and parts for rig systems. I do not know how this business will perform 2016 onwards given the excess supply of deep-water rigs. CTC Media : We sold our shares as explained earlier. Generals: New Positions: GameStop (NYSE: GME ) makes a second appearance to our portfolio. GME is the largest video game retailer in the world and sells new and used video game software, hardware, accessories for video game systems from Sony (NYSE: SNE ), Nintendo ( OTCPK:NTDOY ) and Microsoft. Recently, GME has diversified into other concepts such as Cricket wireless stores and Simply Mac stores. GME has generated annual free cash flow of $450 million. The capital allocation policy is impressive and allows for the distribution of up to 100% of free cash flow to share holders. We purchased shares at a dividend yield of 4% and 10x P/E. Last time we purchased shares of GME, the video game console cycle was long in its tooth. The new consoles from Sony and Microsoft were released in 2013. Sales of games for the older consoles have declined faster than the increase in sales for new consoles. This is weighing on recent results. Once software sales for newer consoles pick up, I feel the shares should get re-rated higher. Generals: Reduced positions: We reduced our large position in Conrad Industries as we grew concerned about the demand for new barges that CNRD builds. The stock appears cheap on a trailing basis but this is a cyclical business and we wanted to be a bit cautious after a superb multiyear run. We sold half of our remaining position in Apple) after the stock doubled since our investment in Q2 2013. We sold half of our position in Franklin Resources (NYSE: BEN ) as it traded close to our conservative price target. My initial assessment on the valuation was higher due to the large net cash of $8 billion (25% of market cap). However, this cash is held overseas and is unlikely to be returned to shareholders. Also, recent asset flows have stagnated at this asset management firm. Generals: Increased positions During the quarter we increased our positions in Visteon warrants (VSTOW) and International Housewares (1373) as they were attractively priced. High Cash levels Cash in the portfolio grew to an all time high of 45%. The reason for this is simply because we sold (33%) a lot more than what we bought (5%) in this quarter. It has become increasingly difficult to find attractive investments as markets overall have run up. However, I continue to look for investments to deploy some of the cash. Often investors question when there are high cash levels as it can detract from performance in a period of rising markets. The value of cash is twofold: it acts as a buffer in declining markets and the optionality it provides to make purchases. Special dividends : Once again Conrad gave us a Christmas gift and declared a special dividend of $1/share. On our original purchase price of $15, we have already received $5/share in dividends. Conrad also instituted a regular quarter dividend of $0.25/share. Asset manager Franklin resources declared a $0.5/share special dividend and raised its dividend. Other news : I am happy to report that I have moved into my new office. At year-end, our AUM was $5.4 million. We wish everyone a prosperous and happy new year 2015. Please contact me if you are interested in our managed account services. This commentary candidly discusses a number of individual companies. These opinions are current as of the date of this commentary but are subject to change. All information provided is for information purposes only and should not be considered as investment advice or a recommendation to purchase or sell any specific security. While the information presented herein is believed to be reliable, no representations or warranty is made concerning the accuracy of any data presented. This communication may not be reproduced without prior written permission from us. Past performance is no guarantee of future results. Motiwala Capital performance is computed on a before-tax time weighted return (TWR) basis and is net of all paid management fees and brokerage costs. Performance figures are unaudited. Performance of individual accounts may vary depending on the timing of their investment, the effects of additions, and the impact of withdrawals from their account. Editor’s Note: This article covers one or more stocks trading at less than $1 per share and/or with less than a $100 million market cap. Please be aware of the risks associated with these stocks.

DGRS Looks Like Great Diversification At First, But Poor Liquidity Is More Likely

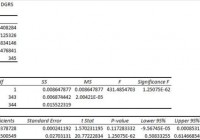
Summary I’m taking a look at DGRS as a candidate for inclusion in my ETF portfolio. The ETF tracks small dividend paying stocks, but the yield isn’t too great. The correlation to SPY is low, but the statistics are unreliable because of poor liquidity. Diversification within the portfolio isn’t bad, but it isn’t amazing either. I’m not assessing any tax impacts. Investors should check their own situation for tax exposure. Investors should be seeking to improve their risk adjusted returns. I’m a big fan of using ETFs to achieve the risk adjusted returns relative to the portfolios that a normal investor can generate for themselves after trading costs. I’m working on building a new portfolio and I’m going to be analyzing several of the ETFs that I am considering for my personal portfolio. One of the funds that I’m considering is the WisdomTree U.S. SmallCap Dividend Growth Fund (NASDAQ: DGRS ). I’ll be performing a substantial portion of my analysis along the lines of modern portfolio theory, so my goal is to find ways to minimize costs while achieving diversification to reduce my risk level. What does DGRS do? DGRS attempts to track the total return (before fees and expenses) of the WisdomTree U.S. SmallCap Dividend Growth Index. At least 90% of the assets are invested in funds included in this index. DGRS falls under the category of “Small Blend”. Does DGRS provide diversification benefits to a portfolio? Each investor may hold a different portfolio, but I use (NYSEARCA: SPY ) as the basis for my analysis. I believe SPY, or another large cap U.S. fund with similar properties, represents the reasonable first step for many investors designing an ETF portfolio. Therefore, I start my diversification analysis by seeing how it works with SPY. I start with an ANOVA table: (click to enlarge) The correlation is excellent at 74.6%. I want to see low correlations on my investments. Extremely low levels of correlation are wonderful for establishing a more stable portfolio. I consider anything under 50% to be extremely low. However, for equity securities an extremely low correlation is frequently only found when there are substantial issues with trading volumes that may distort the statistics. Standard deviation of daily returns (dividend adjusted, measured since August 2013) The standard deviation is great. For DGRS it is .8929%. For SPY, it is 0.6717% for the same period. SPY usually beats other ETFs in this regard. However, many ETFs won’t lose this badly to SPY, but it is worth noting that the standard deviation is pretty high. The best way to counteract the high standard deviation for an ETF with low correlation is to simply use it as a fairly small part of the portfolio. Liquidity is awful Average trading volume is absolutely terrible. The average volume for the last 10 days is only 3,181 shares. It’s possible to buy and sell in an ETF with terrible liquidity, but it is a very unattractive feature for the casual investor seeking diversification. I checked the change in closing values looking for the 0.00% change in dividend adjusted close that could indicate a day in which 0 shares changed hands. In the time period I used, from August 2013 through the middle of December 2014, there were 11 days where there was no change. It is possible that this is simply a coincidence, but investors should be aware that the presence of these days represents a challenge to the validity of the correlation and standard deviation that were calculated. The real values may be lower or higher, though I think higher is more likely than lower. Mixing it with SPY I also run comparisons on the standard deviation of daily returns for the portfolio assuming that the portfolio is combined with the S&P 500. For research, I assume daily rebalancing because it dramatically simplifies the math. With a 50/50 weighting in a portfolio holding only SPY and DGRS, the standard deviation of daily returns across the entire portfolio is 0.7321%. With 80% in SPY and 20% in DGRS, the standard deviation of the portfolio would have been .6811%. If an investor wanted to use DGRS as a supplement to their portfolio, the standard deviation across the portfolio with 95% in SPY and 5% in DGRS would have been .6721%. Why I use standard deviation of daily returns I don’t believe historical returns have predictive power for future returns, but I do believe historical values for standard deviations of returns relative to other ETFs have some predictive power on future risks and correlations. Yield & Taxes The distribution yield is 1.85%. This is a little low for retirees hoping to use the yield for income, but I’d be even more concerned about the poor liquidity if the investor had any liquidity needs. I wouldn’t consider an illiquid investment with only a moderate distribution yield if I were a retiring investor. I’m not a CPA or CFP, so I’m not assessing any tax impacts. Expense Ratio The ETF is posting .38% for both the gross and net expense ratios. I want diversification, I want stability, and I don’t want to pay for them. The expense ratio on this fund is higher than I want to pay for equity securities, but not high enough to make me eliminate it from consideration. I view expense ratios as a very important part of the long term return picture because I want to hold the ETF for a time period measured in decades. Market to NAV The ETF is at a .09% premium to NAV currently. Premiums or discounts to NAV can change very quickly so investors should check prior to putting in an order. The premium isn’t enough to be concerned about, but the liquidity issues could still result in a large bid-ask spread. If an investor was determined to invest in DGRS, I would hope they would use limit orders and be wary of crossing the spread. Largest Holdings The diversification within the ETF isn’t too bad. Unfortunately, it isn’t too good either. The top ten positions are all in the 2% to 1% range. (click to enlarge) Conclusion I’m currently screening a large volume of ETFs for my own portfolio. The portfolio I’m building is through Schwab, so I’m able to trade DGRS with no commissions. I have a strong preference for researching ETFs that are free to trade in my account, so most of my research will be on ETFs that fall under the “ETF OneSource” program. While I like the low correlation, I’m concerned that if liquidity were higher the correlation would also be higher. If the ETF had a substantial increase in volume without a significant increase in correlation, I’d be contemplating it. As it stands currently, I don’t see enough value to make it worth the headache of the low liquidity. I’ll be knocking it off my list of ETFs to consider for my long term portfolio. Additional disclosure: Information in this article represents the opinion of the analyst. All statements are represented as opinions, rather than facts, and should not be construed as advice to buy or sell a security. Ratings of “outperform” and “underperform” reflect the analyst’s estimation of a divergence between the market value for a security and the price that would be appropriate given the potential for risks and returns relative to other securities. The analyst does not know your particular objectives for returns or constraints upon investing. All investors are encouraged to do their own research before making any investment decision. Information is regularly obtained from Yahoo Finance, Google Finance, and SEC Database. If Yahoo, Google, or the SEC database contained faulty or old information it could be incorporated into my analysis. The analyst holds a diversified portfolio including mutual funds or index funds which may include a small long exposure to the stock.